
Risk warning: CFDs are complex instruments and come with a high risk of losing money rapidly due to leverage. The majority of retail investor accounts lose money when trading CFDs. You should consider whether you understand how CFDs work and whether you can afford to take the high risk of losing your money. This page is general information, not financial advice. Advertiser disclosure.
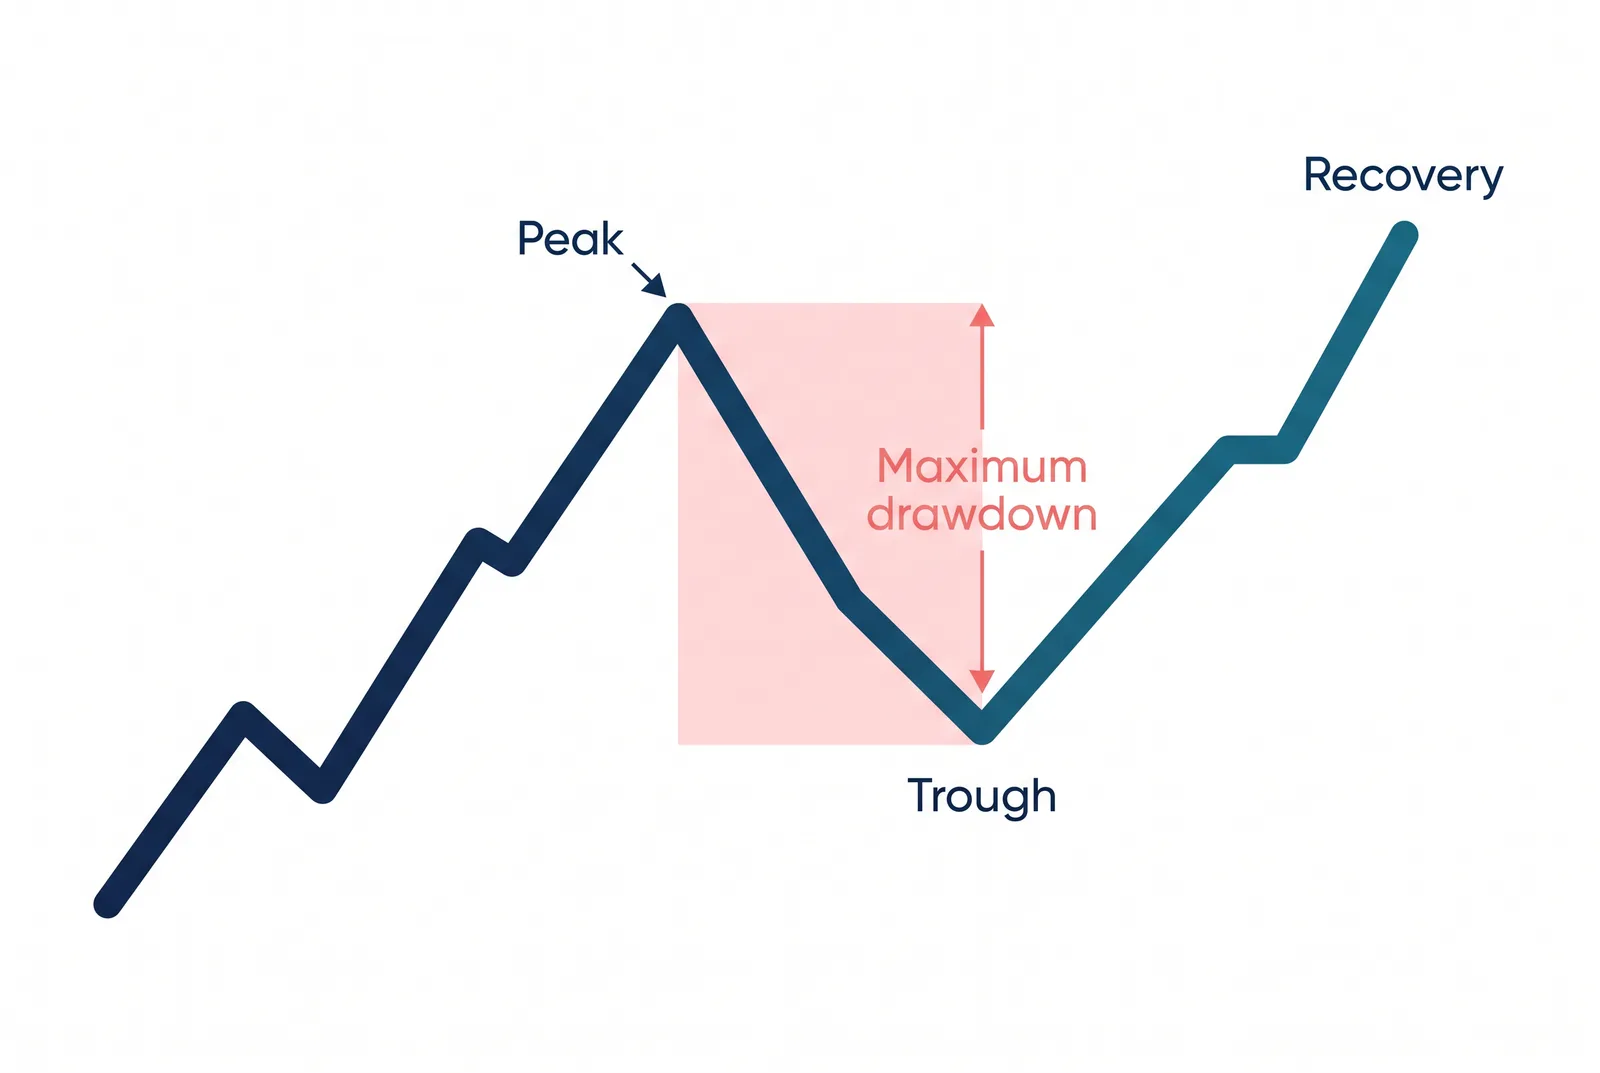
I consider drawdown the clearest risk gauge for a UK trader. It measures the fall from a peak to the subsequent low, shown as a percentage, and ties directly to the FCA’s 50% margin close-out rule.
How is drawdown measured?
Take an account that grows from £10,000 to £12,000, then falls to £9,000 before recovering. The drawdown is measured from the £12,000 peak to the £9,000 low, a fall of 25%. When you see a 25% drawdown, your account lost a quarter of its value from the peak. Maximum drawdown is the largest such peak-to-trough fall over a period, and it shows the worst stretch an account, or a strategy, has endured.
The recovery maths
Drawdown is unforgiving because recovery requires a larger percentage gain than the loss. A 25% drawdown needs a 33% gain to get back to the peak, and a 50% drawdown needs a 100% gain. This asymmetry is why controlling drawdown matters more than chasing returns, since deep losses compound the difficulty of recovery. A 20% loss on a £5,000 account means you need to claw back £1,000; I recommend using the profit and loss calculator to see what a recovery trade must return.
| Drawdown | Gain needed to recover |
|---|---|
| 10% | 11% |
| 25% | 33% |
| 50% | 100% |
| 75% | 300% |
Drawdown Recovery Calculator
Arithmetic only, no market data
33.3%gain required to recover
A 25% drawdown takes a £10,000 account to £7,500.00, and getting back to the peak needs a 33.3% gain on what is left.
- Peak equity£10,000.00
- Equity at the trough£7,500.00
- Lost from the peak£2,500.00
- Gain required to recover33.3%
What is risk of ruin?
Risk of ruin is the chance that a run of losses ends the account before a strategy can recover. It depends on how much you risk per trade, not on the outcome of any single trade. Risk a small fraction each time and even a long losing streak leaves capital to trade with; risk a large fraction and a handful of losses in a row can halve the account. The table shows how many losing trades in a row it takes to lose half the account at a fixed risk per trade.
| Risk per trade | Consecutive losses to halve the account |
|---|---|
| 1% | about 69 |
| 2% | about 34 |
| 5% | about 14 |
| 10% | about 7 |
| 20% | about 3 |
The figures come from compounding the loss: at 2% risk per trade, 0.98 multiplied by itself 34 times is close to 0.5. This is why most risk frameworks cap risk at 1% to 2% of the account per trade, because oversized position sizing turns an ordinary losing streak into a terminal one. Cap risk at 1% to 2% per trade and the forex position size calculator turns that limit and your stop into a lot size, which I find the simplest way to keep drawdown in check.
Drawdown and the FCA backstops
On a leveraged account, drawdown links to the FCA’s 50% margin close-out rule: when account equity falls to half the required margin, the broker starts closing positions. Negative balance protection then prevents a retail account falling below zero. These backstops cap catastrophic loss, but they activate only after a deep drawdown, so they are a floor, not a risk-management plan for your account. They also vary in the fine print between providers, so compare best FCA-regulated forex brokers before relying on them as a safety net. Our testing examines these terms on demo and live GBP-funded accounts. Checking a provider’s negative balance protection and close-out terms against FCA-regulated broker reviews is worth doing before you need them, not after.
Common mistakes
Sizing positions for the upside while ignoring the drawdown they imply leads to accounts that cannot recover. Treating the close-out rule as a stop, rather than a last resort, leaves risk uncontrolled until it is too late. Reading return without drawdown flatters any strategy, which the stop-loss guide helps address. Testing drawdown control on a best demo account before going live catches an oversized strategy before it costs you real money.
Drawdown is the output; position size is the input you control. Our position size calculator turns a balance, a risk percentage and a stop distance into a lot size, and forex stop loss orders for UK traders covers where the stop belongs. For the wider picture, start at our education hub.
Our reviews are reader-supported. We may receive payment when you click a link to a partner site. Learn how we make money.
FAQs
What is drawdown in forex trading?
Why does drawdown matter?
How does drawdown relate to the FCA close-out rule?
Does a demo account show real drawdown?
Related pages
About the author

Justin Grossbard is the co-founder and CEO at CompareForexBrokers. He has traded forex since 1998, leads UK broker research and has personally reviewed every FCA-regulated broker on this site. His work has appeared in Forbes, Kiplinger and Finance Magnates, and he holds a Bachelor of Commerce (Honours) and a Master of Marketing.