
Risk warning: CFDs are complex instruments and come with a high risk of losing money rapidly due to leverage. The majority of retail investor accounts lose money when trading CFDs. You should consider whether you understand how CFDs work and whether you can afford to take the high risk of losing your money. This page is general information, not financial advice. Advertiser disclosure.
I find chart patterns a useful way to spot recurring shapes in price to anticipate the next move. You can sort them into four families: bearish patterns that hint at a fall, bullish patterns that suggest a rise, harmonic patterns built on precise ratios, and candlestick patterns that read the battle between buyers and sellers over one to three candles. Remember, patterns shift the odds; they are probabilities, not certainties.
| Family | Direction signalled | Core patterns | Guide |
|---|---|---|---|
| Bearish | Likely fall | Head and shoulders, double top, rising wedge | Bearish chart patterns |
| Bullish | Likely rise | Inverse head and shoulders, double bottom, falling wedge | Bullish chart patterns |
| Harmonic | Reversal at a Fibonacci ratio | Gartley, Bat, Butterfly | Harmonic patterns |
| Candlestick | Reversal or continuation over 1 to 3 candles | Hammer, engulfing and star patterns | Candlestick patterns |
The pattern families
If you expect a downward move, the bearish chart patterns page covers the head and shoulders and the double top. For a likely rise, the bullish chart patterns page explains the inverse head and shoulders and the double bottom. Harmonic patterns, which use Fibonacci ratios to pinpoint entries, are detailed on the harmonic patterns page with the Gartley, Bat and Butterfly. Candlestick patterns work on a shorter timescale, reading the balance of buyers and sellers over one to three candles through shapes like the hammer and the engulfing pattern; you can find them on the candlestick patterns page. In my view, the easiest way to spot these formations is with drawing tools built into a charting platform such as TradingView.
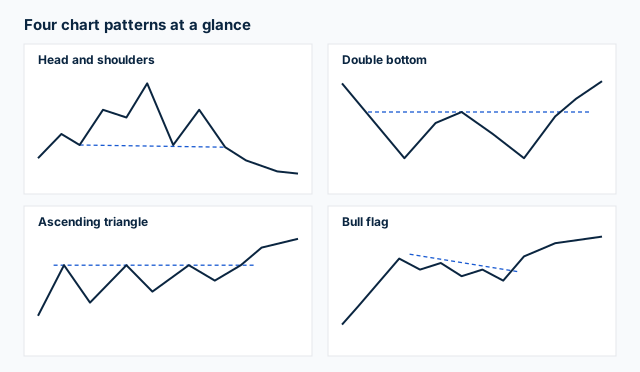
You can see four of the most common formations in the diagram: a head and shoulders and a double bottom as reversals, an ascending triangle and a bull flag as continuations, each with the line that decides its confirmation.
How confirmation works
I treat a pattern as a setup, not a signal, until it confirms. For you, confirmation usually means a close beyond a key level, such as the neckline of a head and shoulders, ideally on rising volume. I would not act before confirmation; false breaks are costly. Judging confirmation is easier on a platform that plots volume alongside price, such as MT4. Each family page sets out the specific confirmation rule for its patterns.
Pattern-recognition tools on UK platforms
Our platform testing shows that most charting platforms now flag patterns automatically. TradingView includes a built-in pattern scanner and price alerts, and a number of FCA-regulated brokers bundle third-party recognition tools such as Autochartist with their MT4 accounts, though availability varies by firm. Automated detection speeds up scanning, but it does not judge context. A flagged double top inside a strong uptrend is still a low-quality setup. Treat a scanner as a shortlist, then apply the confirmation rule on each family page before risking money. You can compare charting strength platform by platform on the trading platforms hub.
Why it matters for a UK trader
Patterns give you a structured way to read price and to place an entry, a stop and a target. They do not change the base reality that most retail accounts lose money, so a pattern is a tool within a risk-managed plan, not a route to certain profit. Position sizing and a stop, covered in the stop-loss guide, matter more than the pattern itself. In my view, based on our testing, choosing a broker with strong charting tools and tight execution matters as much as the pattern itself; you can compare UK forex brokers on charting and execution.
Common mistakes
Traders often make the mistake of trading a pattern before it confirms, because unconfirmed patterns fail often. Seeing patterns everywhere leads to forced trades that the chart does not support. Treating a pattern as a guarantee, rather than a probability, removes the risk management that makes it useful. You can find the full set of strategy and risk guides on the education hub.
A pattern sets the levels; the position size has to follow the stop those levels imply. Our position size calculator does that conversion, and the shortest-timeframe family is covered on candlestick patterns for UK traders.
Our reviews are reader-supported. We may receive payment when you click a link to a partner site. Learn how we make money.
FAQs
What are forex chart patterns?
Do chart patterns actually work?
What is the difference between bearish, bullish and harmonic patterns?
Can software find chart patterns for me?
Related pages
About the author

Justin Grossbard is the co-founder and CEO at CompareForexBrokers. He has traded forex since 1998, leads UK broker research and has personally reviewed every FCA-regulated broker on this site. His work has appeared in Forbes, Kiplinger and Finance Magnates, and he holds a Bachelor of Commerce (Honours) and a Master of Marketing.