
Risk warning: CFDs are complex instruments and come with a high risk of losing money rapidly due to leverage. The majority of retail investor accounts lose money when trading CFDs. You should consider whether you understand how CFDs work and whether you can afford to take the high risk of losing your money. This page is general information, not financial advice. Advertiser disclosure.
I treat bearish chart patterns as price formations that warn of a likely fall, typically when an uptrend runs out of buyers or a range breaks down. For a UK trader, they provide a framework to plan a short entry, a protective stop and a downside target, but you act only after the pattern confirms on a close below its key level. They tilt the odds toward a decline rather than promising one, and most retail accounts lose money trading CFDs.
The main patterns
Five formations cover the bulk of bearish setups you are likely to draw. Each has its own trigger level, so the shape only matters once the price closes through it.
Head and shoulders
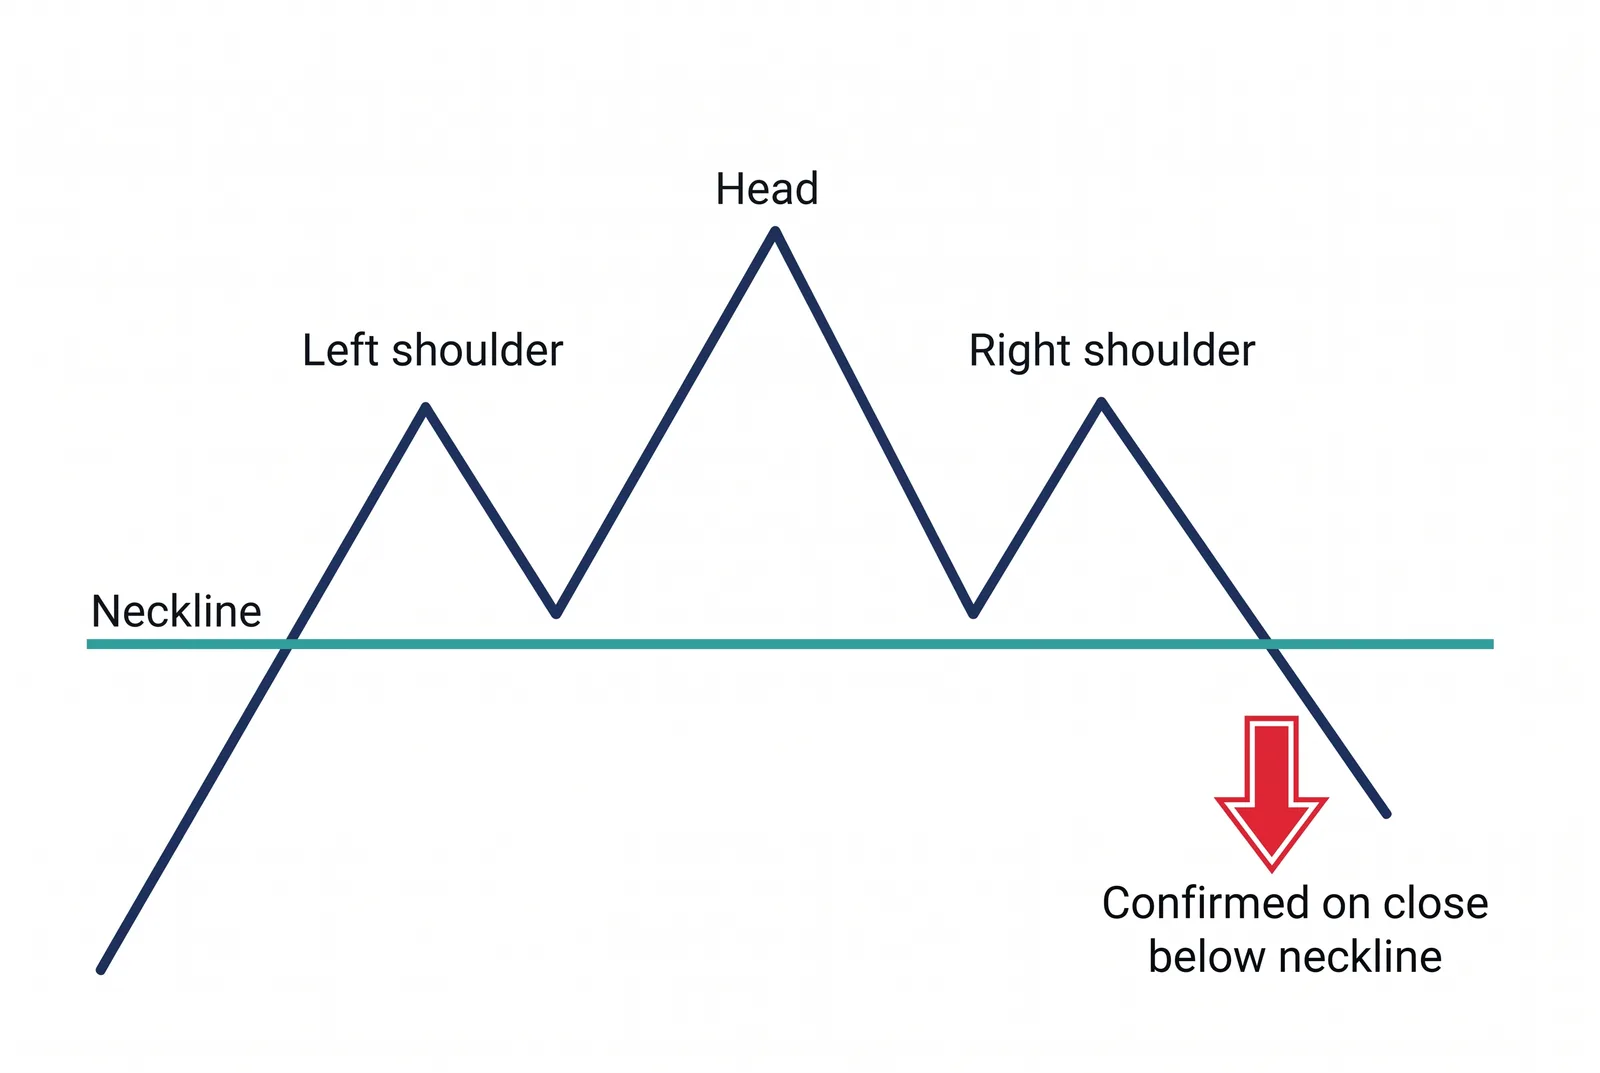
A peak between two lower peaks. It signals a top once the price closes below the neckline, the line joining the two troughs between the peaks. The measured target is the height of the head projected down from the neckline.
Double top
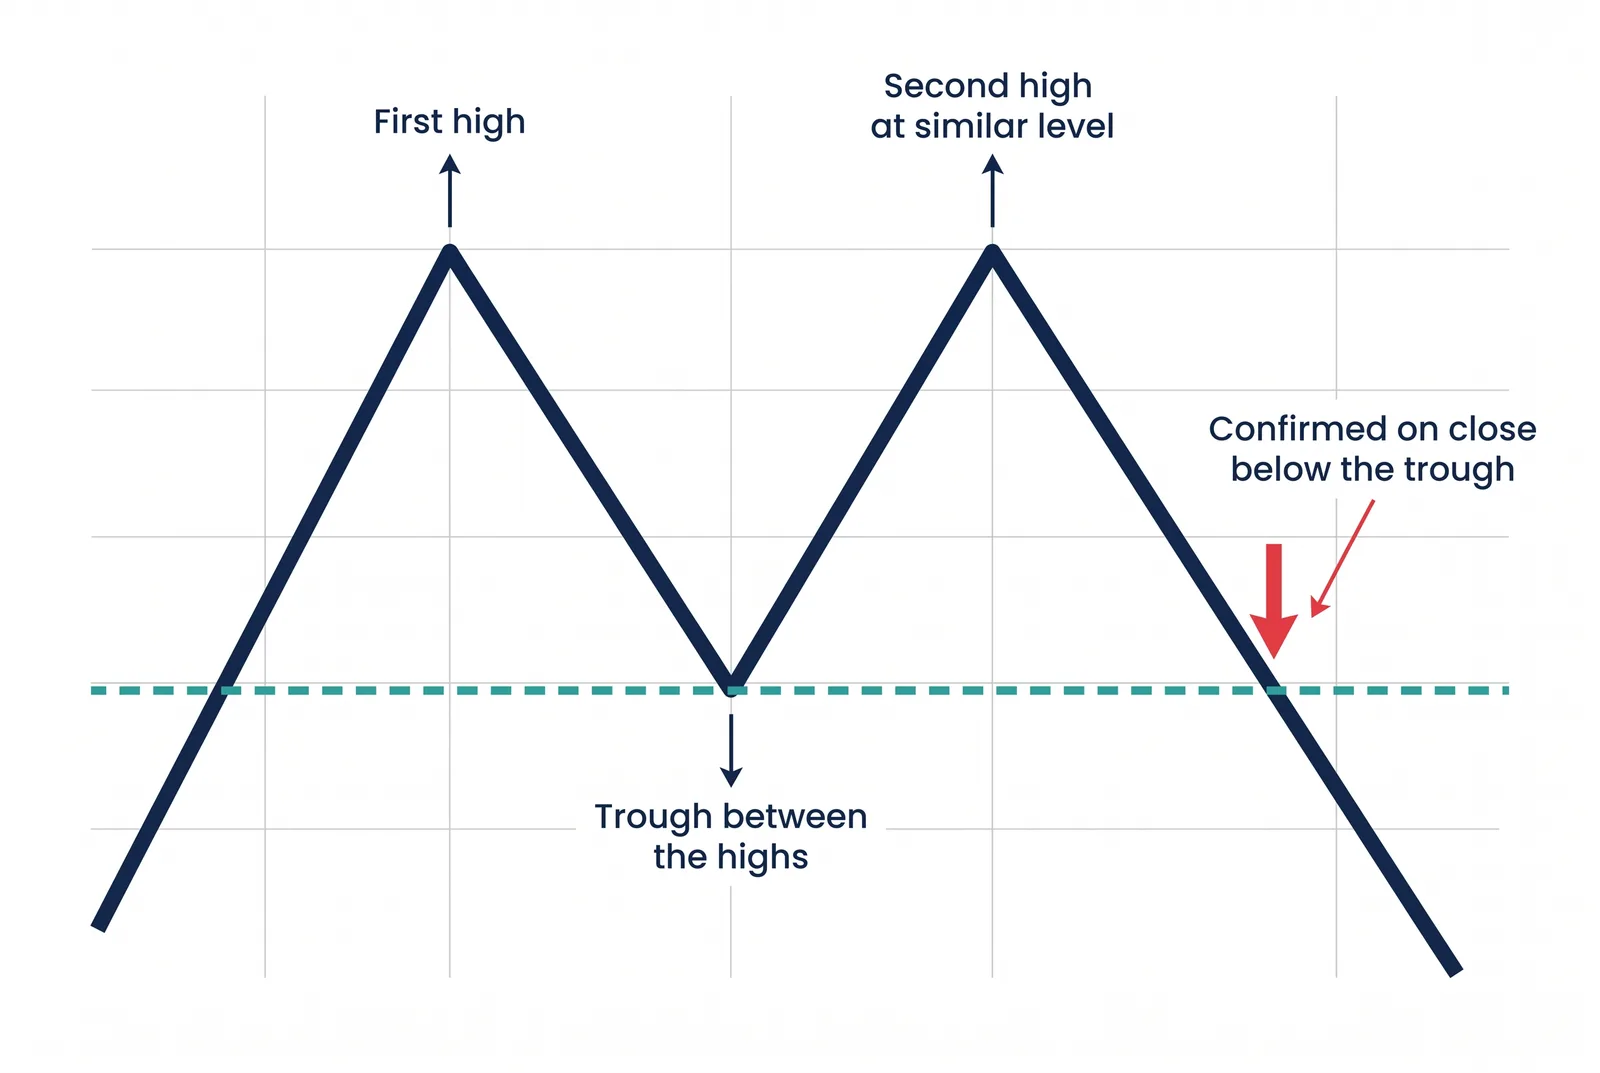
Two failed pushes to a similar high. It confirms when the price breaks the trough between the two peaks, showing that sellers defended the same level twice.
Rising wedge
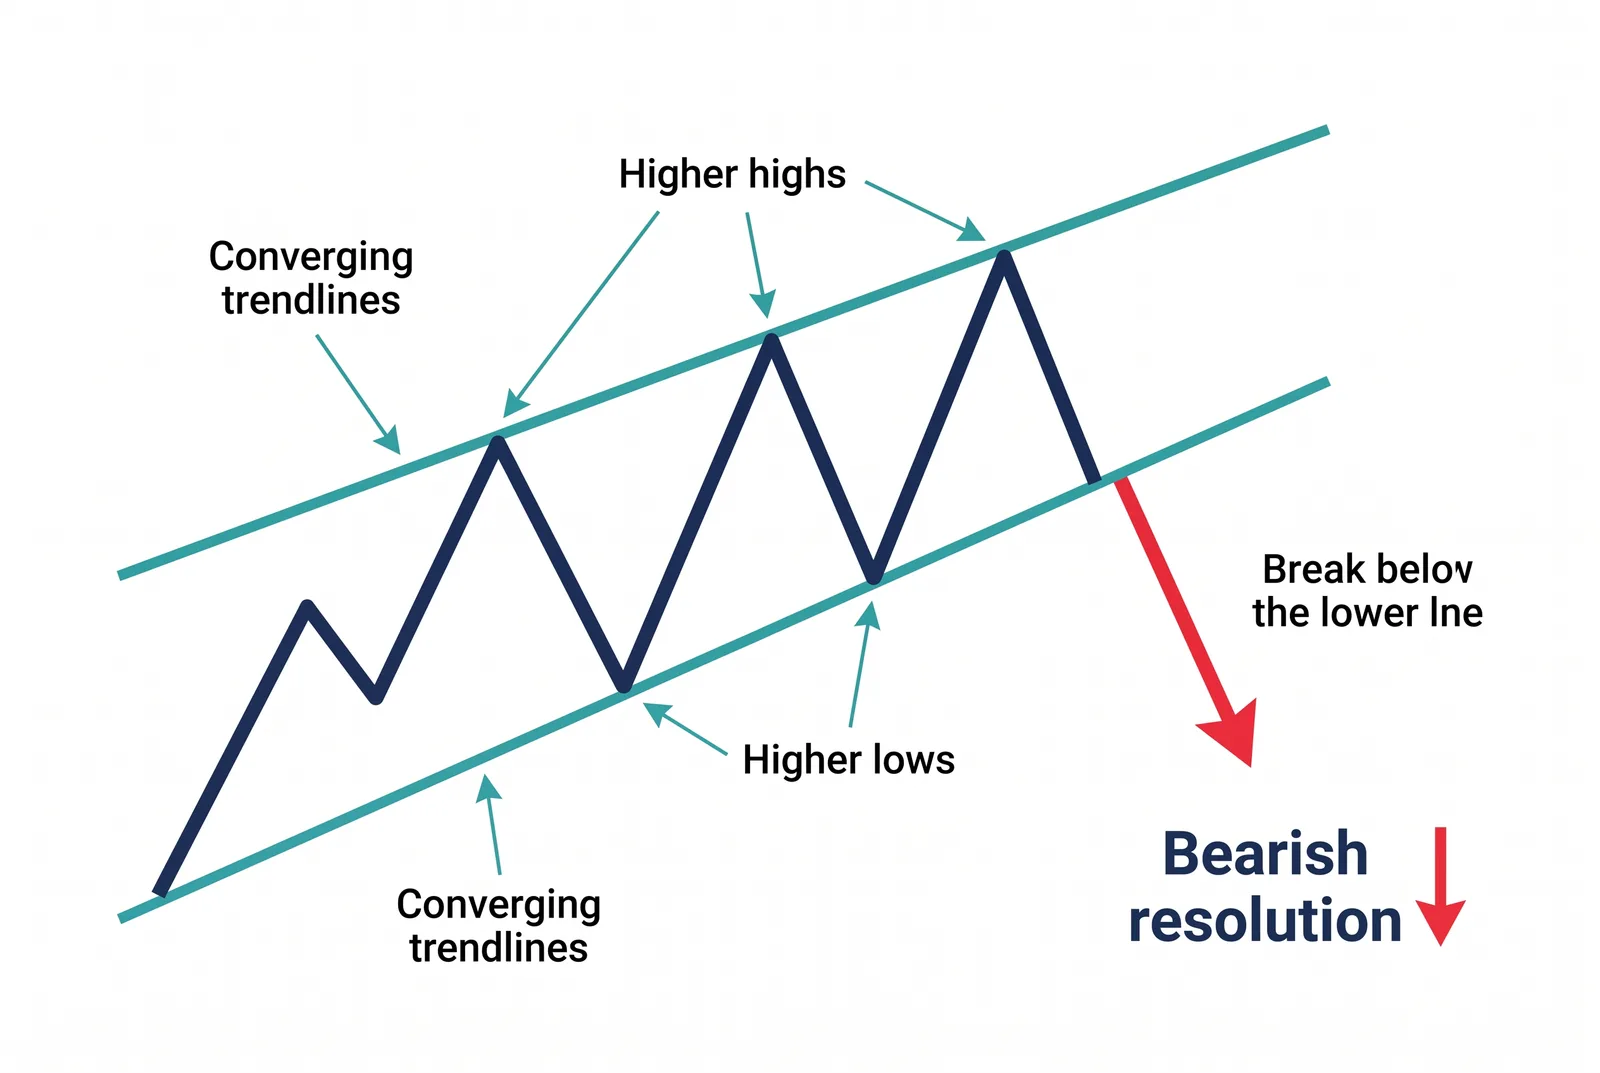
A narrowing upward channel in which each rally makes less progress than the last. It often resolves downward on a break of the lower trendline, especially after an extended uptrend has already stretched.
Descending triangle
A flat floor of support tested repeatedly beneath a series of lower highs. A close below the floor confirms the pattern, and the repeated tests tend to weaken the level rather than strengthen it.
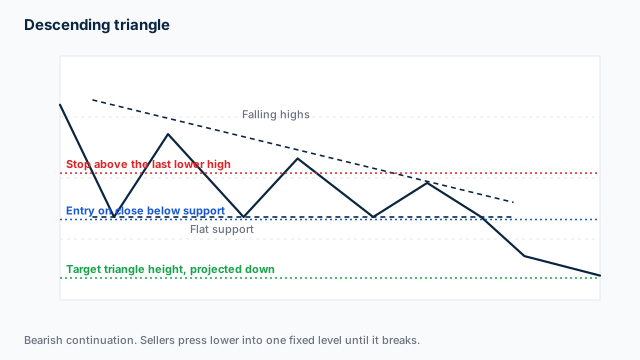
The diagram shows the flat support line, the lower highs above it, and where the entry, stop and measured target fall. The formation needs at least two touches of that horizontal support and two or more lower highs. Confirmation is a close below the support line, not a wick through it. Invalidation is a close back above the most recent lower high, which removes the compression the pattern depends on. For sizing, a £10,000 account risking 1% puts £100 at risk. With a 40-pip stop on GBP/USD at roughly £8 per pip, that sizes your position near 0.31 standard lots.
Bearish flag
A brief upward drift inside two parallel lines after a sharp fall. A close below the lower line signals that the prior downtrend is resuming.
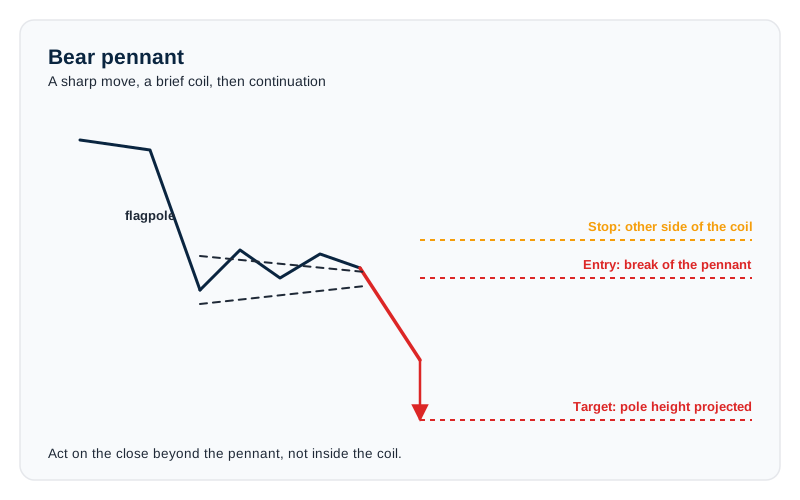
The bear pennant mirrors the bull version on the way down, coiling into a small symmetrical triangle instead of drifting up a channel. The diagram marks the flagpole, the coil and the levels. Formation: a steep fall, then converging trendlines forming a tight triangle. Confirmation: a close below the coil’s lower trendline. Invalidation: a close above the coil’s high, or a coil that outlasts the flagpole. For you, the same £100 of risk on a wider 40-pip stop at £8 a pip sizes your position near 0.31 standard lots.
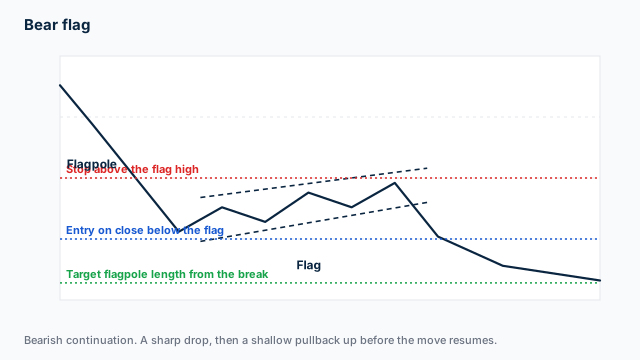
The flag’s measured target runs one flagpole length from the break. The diagram shows the flagpole drop, the tight pullback channel and that target. Formation: a steep fall, then a shallow counter-trend drift retracing less than half of it inside two parallel lines. Confirmation: a close below the lower line of the flag. Invalidation: a close above the flag’s high, or a pullback that retraces more than half the flagpole, at which point the move is a reversal rather than a pause. For you, the same £100 of risk on a tighter 25-pip stop sizes your position near 0.50 standard lots. That is why the stop distance, not conviction, sets your size. Our team assesses broker platforms, including MT4 and cTrader, on demo and live GBP-funded accounts.
In my view, you will find these formations easiest to draw and measure with the tools built into TradingView or MT4.
How they confirm
I insist on waiting for a close below the pattern’s key support, whether that is the neckline, the trough or the lower trendline, not a mere touch. Because spot forex has no central exchange, a platform’s volume figure is really a tick count standing in for true volume; you should weight the closing price and the follow-through candle more heavily than that reading. Selling before the close invites false breaks, where support is probed and then rejected. Over a run of trades, fewer, confirmed entries beat early ones for you.
Managing the risk
Place the stop just above the level that invalidates the pattern, the right shoulder or the second top, because a failed breakdown tends to squeeze late sellers hard as the price snaps back through the neckline. From there, size your position so the loss to the stop is a fixed pound amount, as set out in the stop-loss guide. Leverage must stay within the FCA retail caps, 30:1 on major pairs, and the 50% margin close-out and negative balance protection apply as backstops. In my view, a bearish setup earns its keep over a run of confirmed trades, not on any single short for you.
| Pattern | Head and shoulders, GBP/USD |
|---|---|
| Neckline | 1.2650 |
| Stop | 50 pips above right shoulder |
| Risk | 1% of £10,000 (£100) |
| Position size | ~0.25 standard lots at £8/pip |
On this setup, risking £100 to a 50-pip stop sizes the position at roughly 0.25 standard lots.
Common mistakes
Shorting before the pattern confirms is the usual error, since an unconfirmed top often fails and the uptrend simply resumes. Running the short without a stop because the shape looks textbook leaves the loss undefined when that resumption comes. Forcing a head and shoulders onto a chart that does not show one leads to trades the price never supports. I would check execution speed and slippage on a confirmed breakdown for your broker using FCA-regulated brokers compared on cost and execution. The patterns hub and the sibling pattern pages set out the wider context.
Our position size calculator turns the stop each pattern implies into a lot size. For the other side of the setup, see bullish chart patterns for UK traders and candlestick patterns for UK traders. For the wider picture, start at our education hub.
Our reviews are reader-supported. We may receive payment when you click a link to a partner site. Learn how we make money.
FAQs
What are bearish chart patterns?
How do I confirm a bearish chart pattern?
Are bearish patterns reliable?
What stop-loss should I use on a head and shoulders pattern?
Related pages
About the author

Justin Grossbard is the co-founder and CEO at CompareForexBrokers. He has traded forex since 1998, leads UK broker research and has personally reviewed every FCA-regulated broker on this site. His work has appeared in Forbes, Kiplinger and Finance Magnates, and he holds a Bachelor of Commerce (Honours) and a Master of Marketing.