
Risk warning: CFDs are complex instruments and come with a high risk of losing money rapidly due to leverage. The majority of retail investor accounts lose money when trading CFDs. You should consider whether you understand how CFDs work and whether you can afford to take the high risk of losing your money. This page is general information, not financial advice. Advertiser disclosure.
Bullish chart patterns are price formations that point to a likely move higher, most often a reversal after a decline or a pause within an uptrend. As a UK trader, you use them to plan an entry above resistance, your protective stop and your target, and you only act when the pattern confirms. In my view, they tilt the odds of a rise rather than promise one, and most retail accounts still lose money trading CFDs.
The main patterns
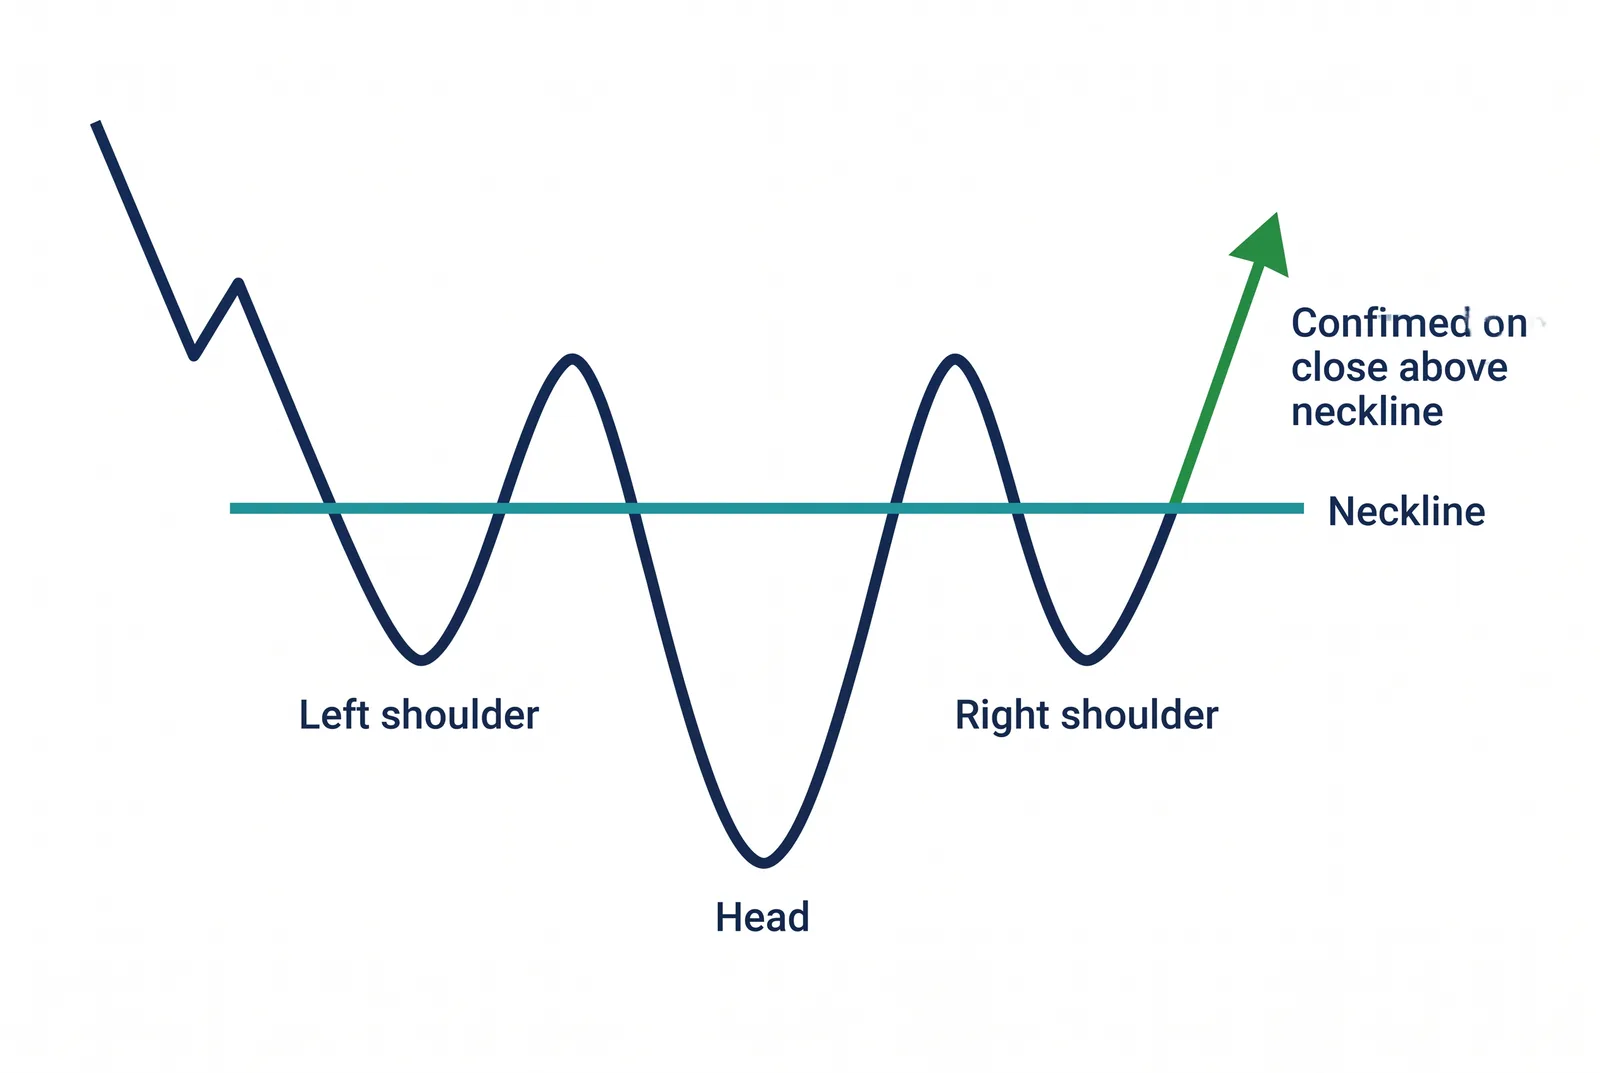
Inverse head and shoulders
A trough between two higher troughs. It signals a bottom once the price closes above the neckline joining the two peaks between the troughs. The measured target is the depth of the head projected up from the neckline.
Double bottom
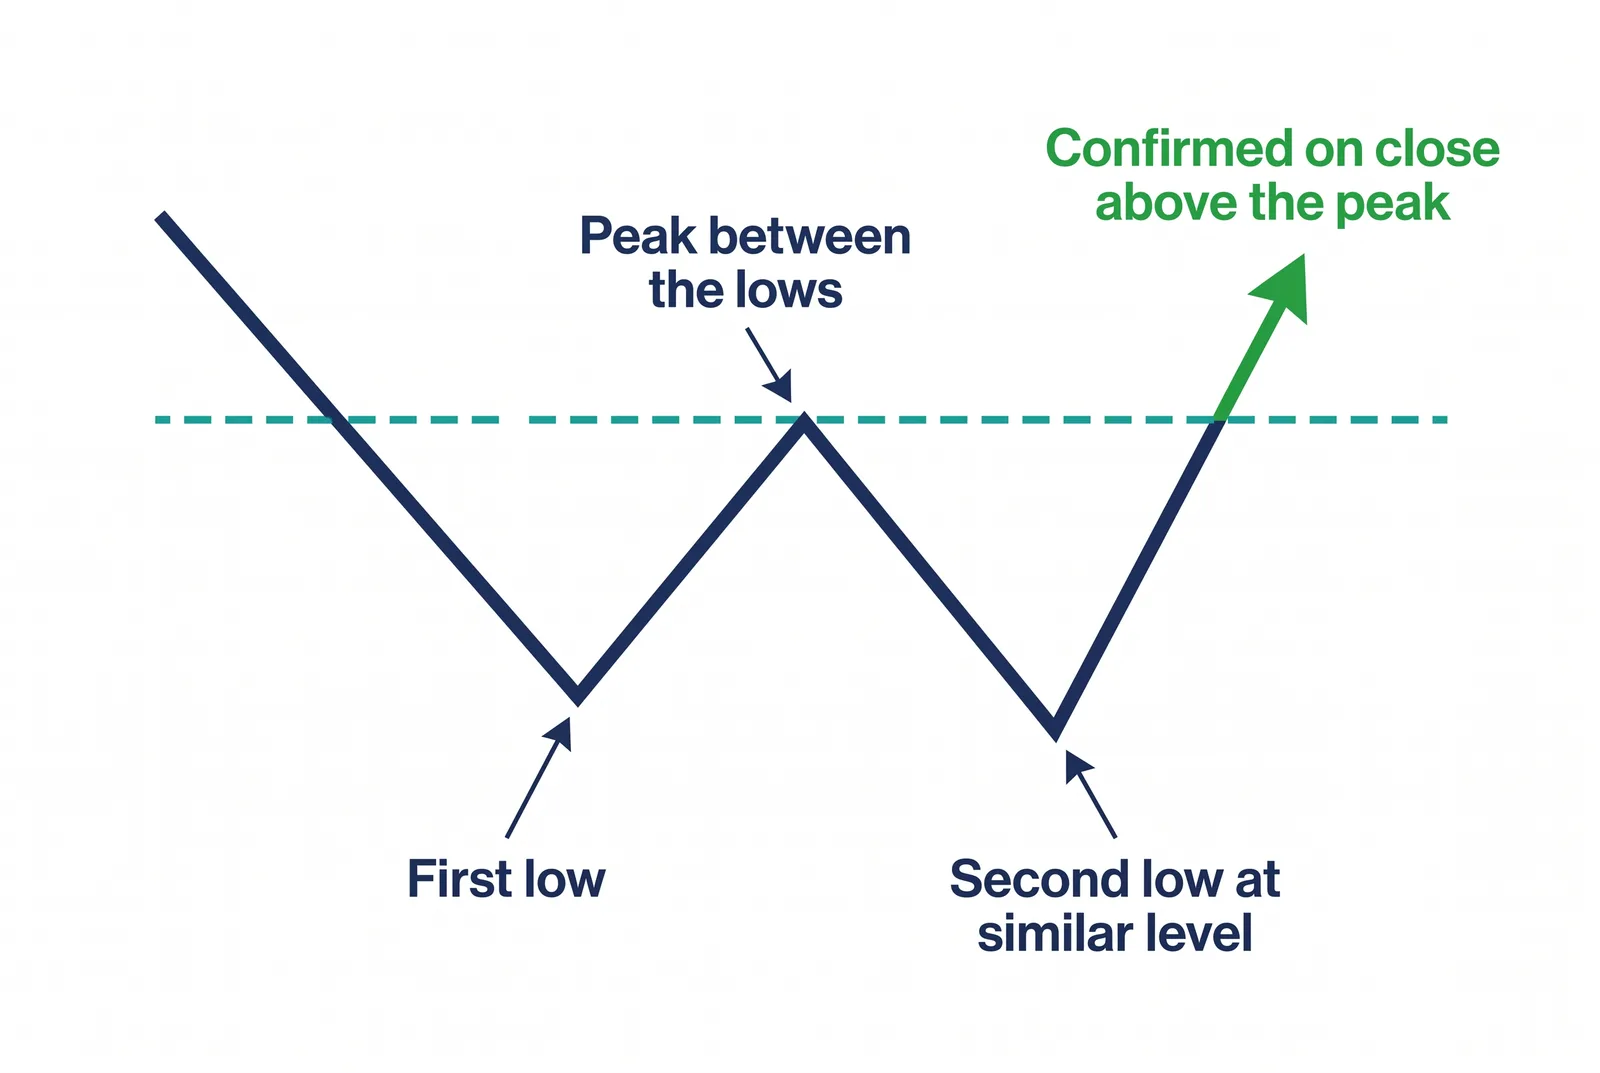
Two failed pushes to a similar low. It confirms when the price breaks the peak between the two troughs, showing buyers defended the level twice.
Falling wedge
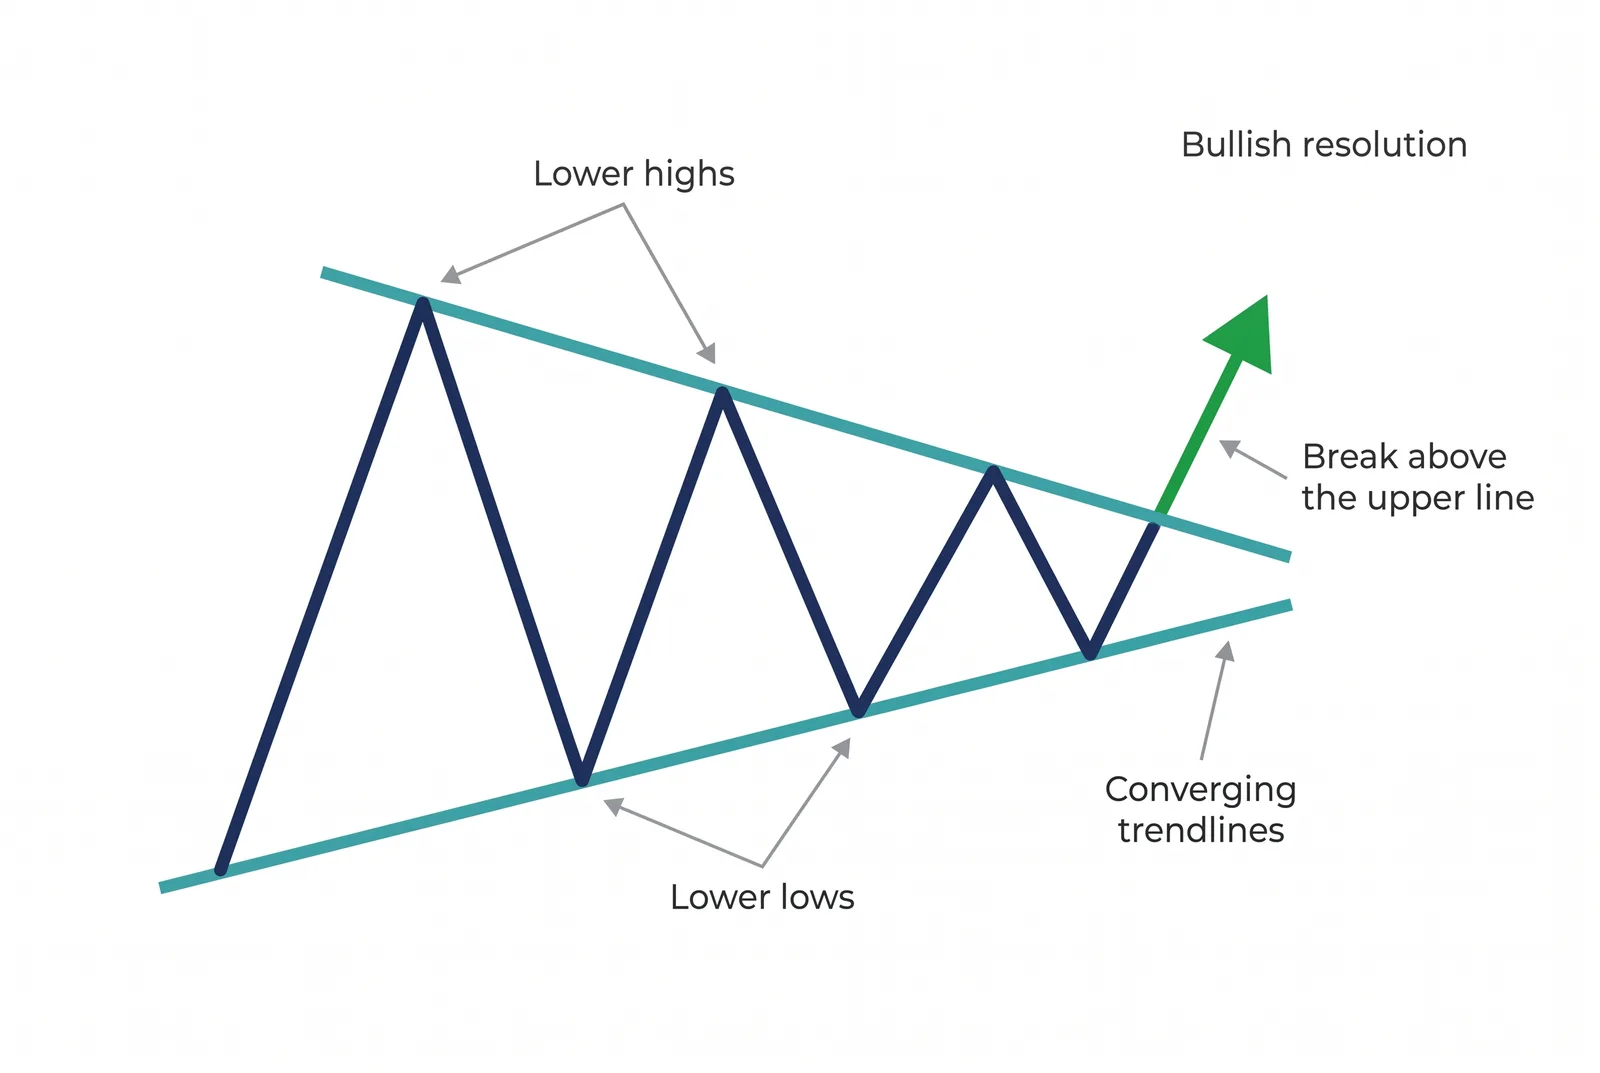
A narrowing downward channel in which each decline makes less progress. It often resolves upward on a break of the upper trendline, especially after an extended downtrend.
Ascending triangle
A flat ceiling of resistance tested repeatedly above a series of higher lows. A close above the ceiling confirms the pattern; each test uses up the supply sitting at the level.
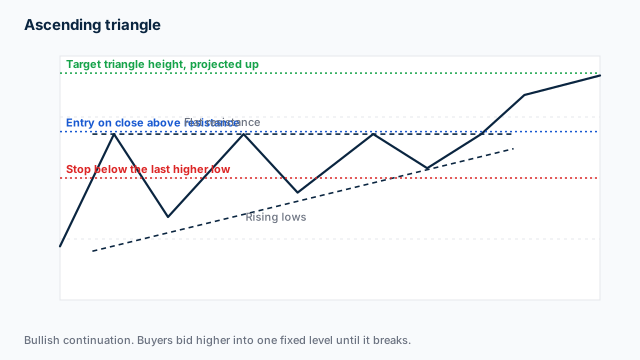
The diagram shows the flat resistance line, the rising lows beneath it, and where your entry, stop and measured target fall. Formation: two or more touches of one horizontal resistance with higher lows underneath. Confirmation: a close above the resistance line, ideally holding on the retest. Invalidation: a close below the most recent higher low, which breaks the rising floor the pattern is built on. Sizing: on a £10,000 account risking 1%, a 40-pip stop on GBP/USD at roughly £8 a pip sizes your position near 0.31 standard lots for £100 of risk. That is 1% of the account, so the stop distance and risk percentage set the size, not how good the setup looks.
Bullish flag
A brief downward drift inside parallel lines after a sharp rise. A close above the upper line signals the prior uptrend is resuming.
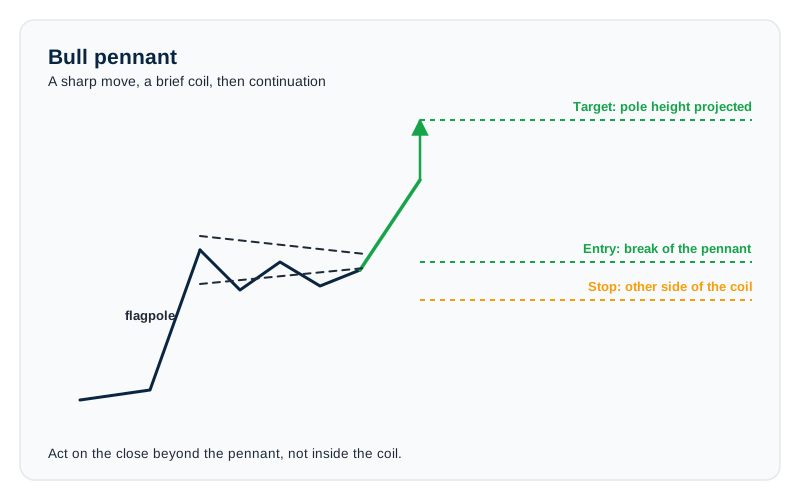
The diagram marks the flagpole, the coil and the levels. The bull pennant compresses a sharp rise into a brief symmetrical coil rather than the parallel channel a flag draws, which is the only thing separating the two. Formation: a steep rally, then converging trendlines forming a small triangle that drifts sideways rather than sloping against the move. Confirmation: a close above the coil’s upper trendline. Invalidation: a close below the coil’s low, or a coil that takes longer to form than the flagpole took to run. Sizing: £100 of risk on a 30-pip stop at roughly £8 a pip sizes near 0.42 standard lots, meaning the position is larger than with a wider stop, so the stop distance directly affects your exposure. Our team tests broker platforms and accounts.
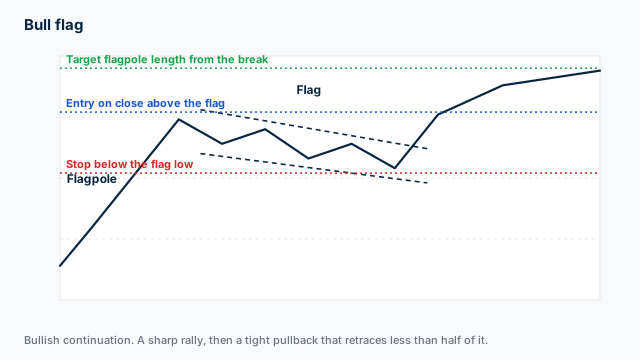
The diagram shows the flagpole, the tight pullback that forms the flag, and the target measured as the flagpole length projected from the break. Formation: a sharp rally, then a shallow drift lower retracing less than half of it between two parallel lines. Confirmation: a close above the upper line of the flag. Invalidation: a close below the flag’s low, or a pullback deeper than half the flagpole, which turns the pause into a reversal. Sizing: the same £100 of risk on a tighter 25-pip stop sizes near 0.50 standard lots, so the stop distance sets the size rather than how good the setup looks, which is a discipline I value.
Drawing and measuring these formations is easiest with the tools built into TradingView or MT4.
How they confirm
A bullish pattern confirms on a close above its key resistance, whether the neckline, the peak between two bottoms, or the upper trendline, rather than on a touch of it. Breakouts above resistance draw in momentum buyers, which is why you should give the follow-through candle after the close as much attention as the close itself. I would not buy before confirmation, because that risks a false break where resistance is probed and then holds. Fewer, confirmed entries beat early ones over time.
Managing the risk
Set the stop below the point that invalidates the pattern, under the right shoulder, the second bottom or the wedge support, since a breakout that falls back into its base has usually failed rather than paused. In my view, you then size the position so the loss to that stop is a fixed pound amount, as set out in the stop-loss guide. Any leverage stays within the FCA retail caps, 30:1 on major pairs, and the 50% margin close-out and negative balance protection apply as backstops. Buying a confirmed base is a probability play; the sizing is what keeps a failed one affordable.
| Pattern | Inverse head and shoulders, EUR/USD |
|---|---|
| Neckline | 1.0850 |
| Stop | 40 pips below right shoulder |
| Risk | 1% of £10,000 (£100) |
| Position size | ~0.31 standard lots at £8/pip |
If you risk £100 to a 40-pip stop on this setup, your position is sized at roughly 0.31 standard lots.
Common mistakes
In my view, buying the anticipation rather than the breakout is the usual error, since a base that never closes above resistance often just resumes the downtrend. Dropping the stop because an inverse head and shoulders looks textbook turns a planned small loss into a large one, and you want to avoid that. Reading a reversal into a chart that is still printing lower highs forces a trade the price does not support. Check execution speed and slippage on a confirmed upside breakout with FCA-regulated brokers compared on cost and execution. The patterns hub and the sibling pattern pages set out the wider context.
Our position size calculator turns the stop each pattern implies into a lot size. For the mirror-image setups, see bearish chart patterns for UK traders and candlestick patterns for UK traders. For the wider picture, start at our education hub.
Our reviews are reader-supported. We may receive payment when you click a link to a partner site. Learn how we make money.
FAQs
What are bullish chart patterns?
How do I confirm a bullish chart pattern?
Are bullish patterns reliable?
What stop-loss should I use on an inverse head and shoulders pattern?
Related pages
About the author

Justin Grossbard is the co-founder and CEO at CompareForexBrokers. He has traded forex since 1998, leads UK broker research and has personally reviewed every FCA-regulated broker on this site. His work has appeared in Forbes, Kiplinger and Finance Magnates, and he holds a Bachelor of Commerce (Honours) and a Master of Marketing.