
Risk warning: CFDs are complex instruments and come with a high risk of losing money rapidly due to leverage. The majority of retail investor accounts lose money when trading CFDs. You should consider whether you understand how CFDs work and whether you can afford to take the high risk of losing your money. This page is general information, not financial advice. Advertiser disclosure.
Harmonic chart patterns are price structures that point to a probable reversal where Fibonacci ratios align. I find them useful because they give you an entry, a stop and a target from the same completion point. You act only when the price reverses there, not on a breakout. Like any pattern, they are probabilities managed with a risk plan, not certainties, and most retail accounts lose money trading CFDs.
The main patterns
All four main harmonic patterns share a five-point XABCD structure, but each is defined by where the D point lands. In my view, the Gartley defines a precise reversal entry using Fibonacci retracements. The Bat, a deeper variant, offers a tightly defined completion point. If you prefer extension patterns, the Butterfly completes beyond the start of the structure at a Fibonacci projection. The Crab is the most extended, finishing at a 1.618 projection of XA, which places its D point furthest from the origin and typically demands the widest stop.
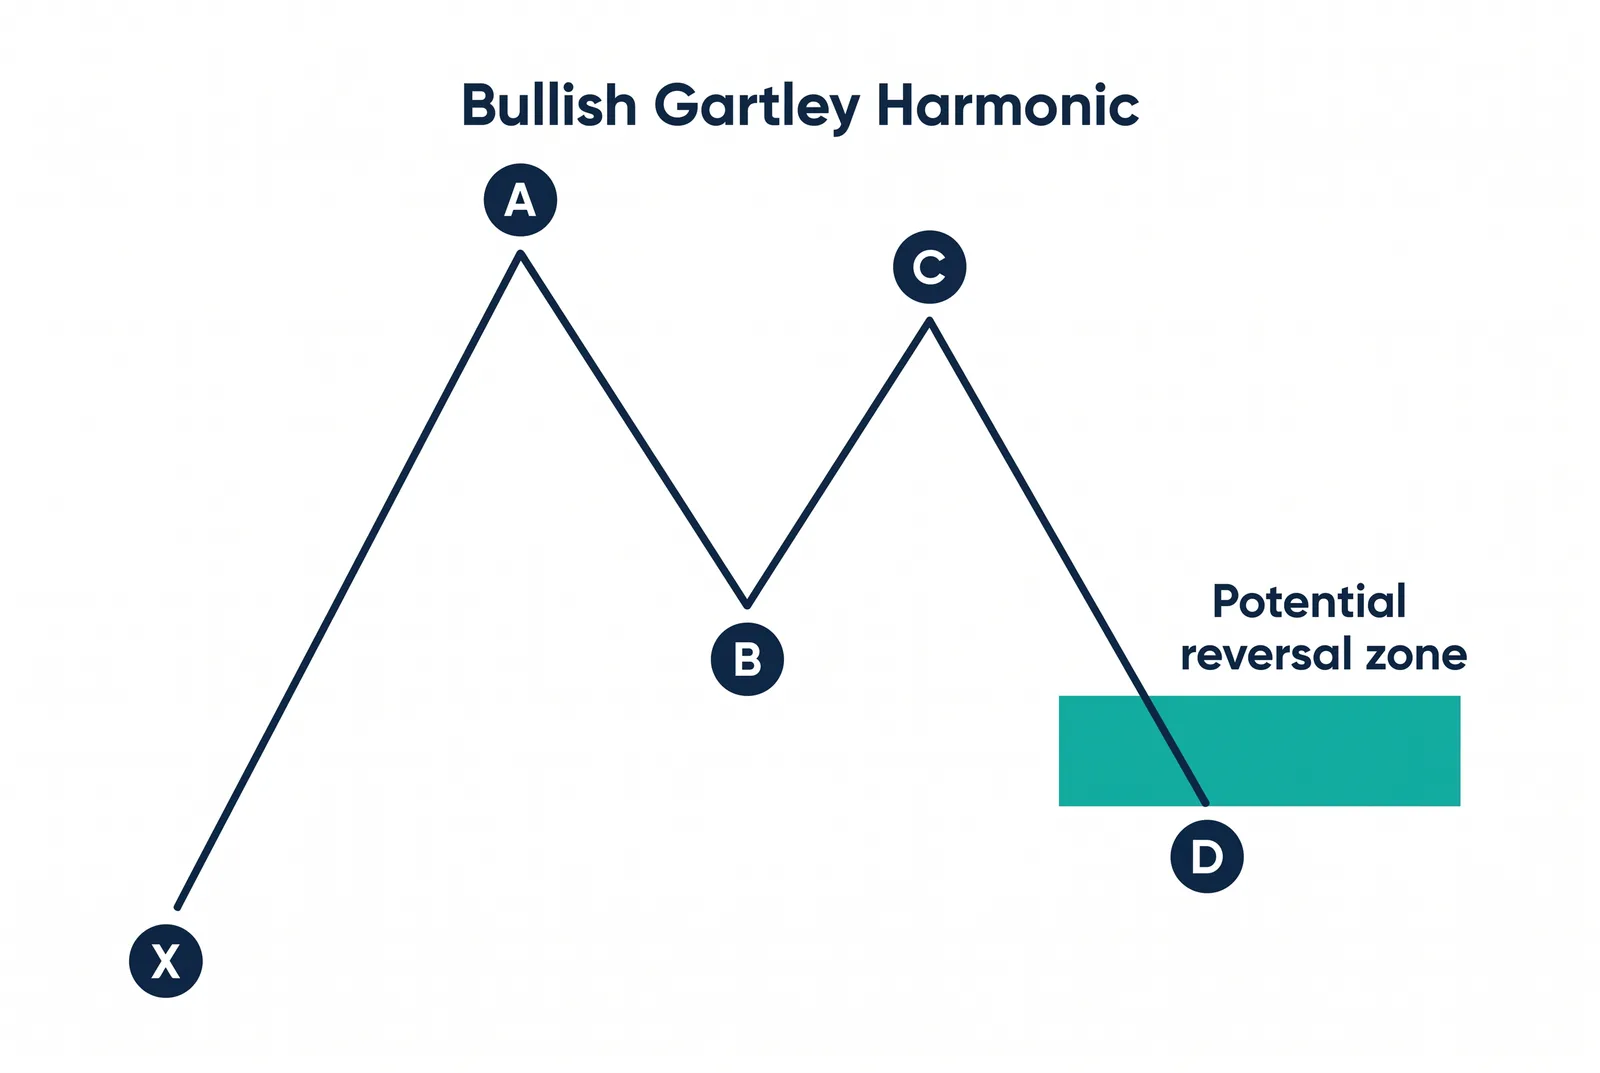
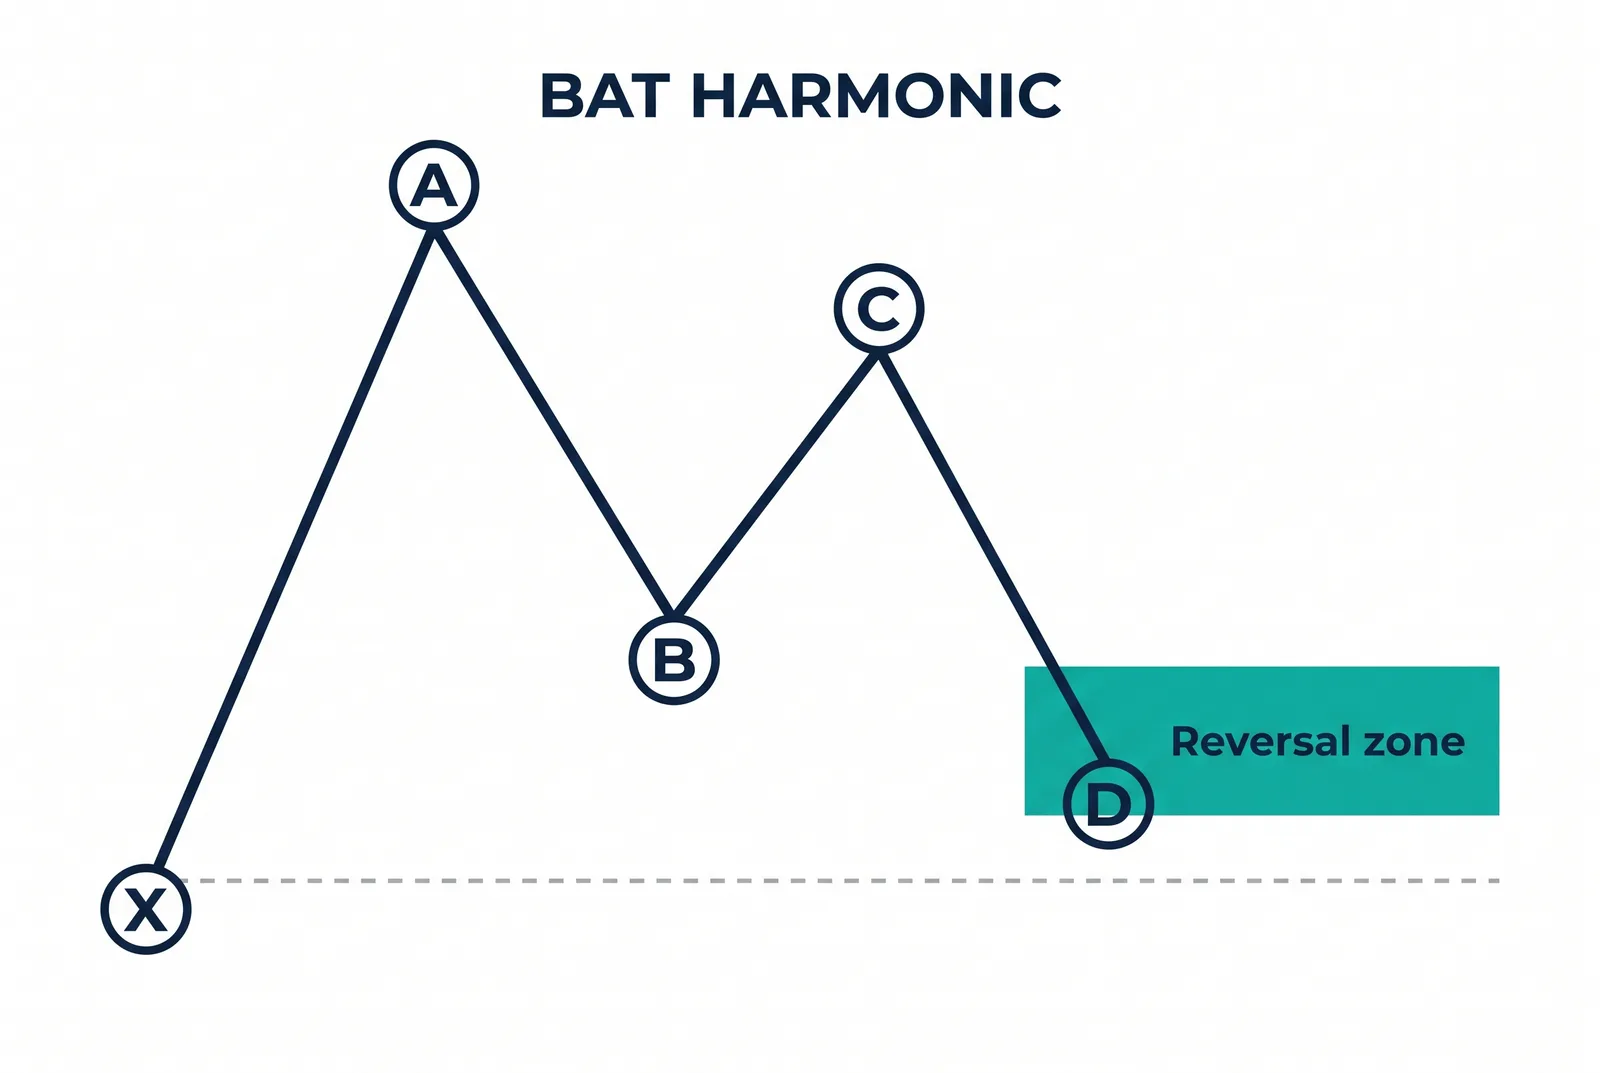
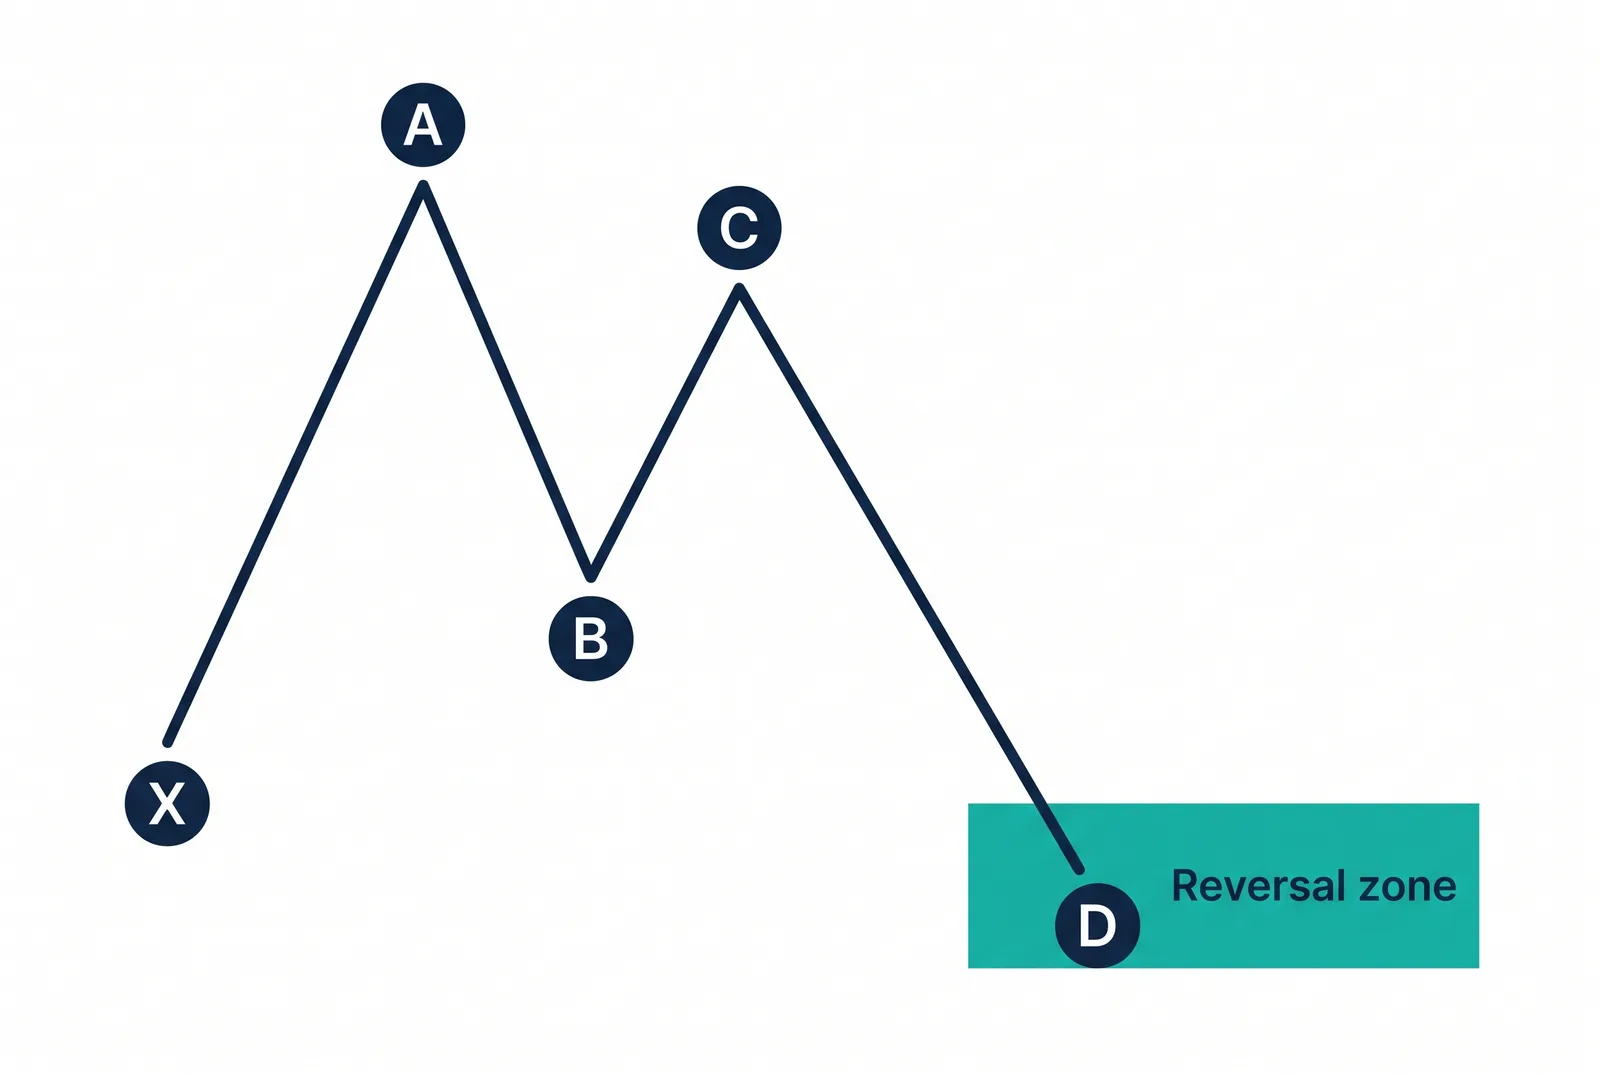
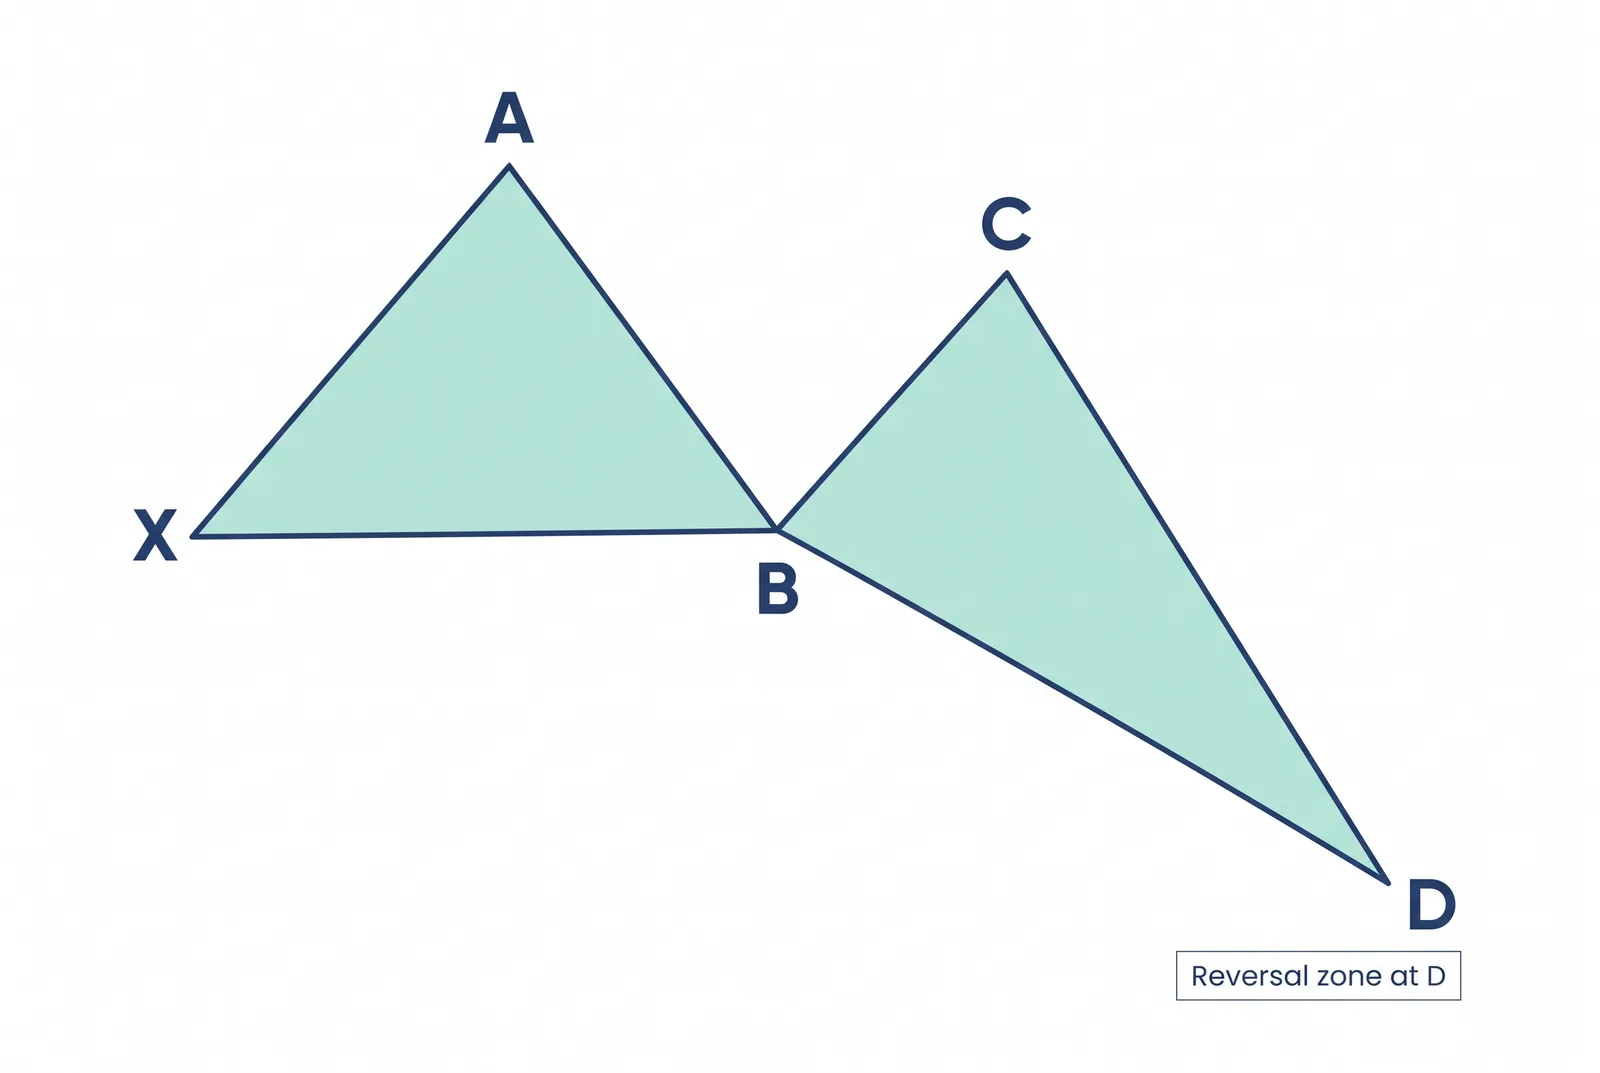
Each pattern is defined by where its D point completes relative to the initial XA leg:
| Pattern | D point vs XA leg | Character |
|---|---|---|
| Gartley | 0.786 retracement | Shallowest completion |
| Bat | 0.886 retracement | Deep retracement, tight stop |
| Butterfly | 1.27 to 1.618 extension | Completes beyond X |
| Crab | 1.618 extension | Most extended, widest stop |
Each is only a setup until the price confirms the reversal at its D point, so for you the confirmation rule matters as much as the shape.
TradingView provides Fibonacci drawing tools that plot these ratios, with automatic harmonic pattern detection offered on its paid plans. MT4 also carries manual Fibonacci retracement and extension tools for traders who prefer to mark up the ratios themselves.
How they confirm
Harmonic patterns confirm differently from breakout patterns. Because the trade is a reversal at the D point, confirmation means the price rejects the completion zone, not closes beyond a level. I recommend waiting for the price to reach the Fibonacci completion, the potential reversal zone, and print a reversal signal there, such as an engulfing candle or a failed push beyond D, before you enter. Entering on the touch of the ratio alone treats a forecast level as a fill level. If the price closes decisively through D, the pattern is invalid and no trade exists.
Managing the risk
I place the stop just beyond D, because a decisive close through the completion zone means the harmonic count is wrong and the trade has no basis. Size your position so the loss to that stop is a fixed pound amount, as set out in our stop-loss guide. Any leverage used stays within the FCA retail caps, 30:1 on major pairs, and the 50% margin close-out and negative balance protection apply as backstops. The ratios give a harmonic trade an unusually precise invalidation point; using it is the pattern’s real edge.
| Worked example | Detail |
|---|---|
| Pattern | Bat, EUR/USD |
| Completion (D point) | 1.0920 |
| Stop | 30 pips beyond the D point |
| Risk | 1% of £10,000 (£100) |
| Position size | ~0.33 standard lots at £10 per pip |
On this Bat completion, risking £100 to a 30-pip stop sizes the position at roughly 0.33 standard lots.
Common mistakes
Entering on the touch of the ratio rather than the rejection is the usual error I see, because a level forecast is not a fill. Trading a completion without a stop wastes the one advantage harmonics offer: a precisely defined invalidation point. Stretching the ratios until a pattern appears produces completions the market never drew. You can compare spread and execution quality for fast-moving reversal trades across our list of top FCA-regulated forex brokers, where our live-account testing helps you find a broker that suits your style. Our team conducts this testing on live accounts. The patterns hub and the sibling pattern pages set out the wider context.
Our position size calculator turns the tight stop beyond D into a lot size. If the Fibonacci work is new, the classical setups on bullish chart patterns for UK traders are the gentler starting point. For the wider picture, start at our education hub.
Our reviews are reader-supported. We may receive payment when you click a link to a partner site. Learn how we make money.
FAQs
What are harmonic chart patterns?
How do I confirm a harmonic pattern?
Are harmonic patterns reliable?
What Fibonacci ratio defines a Gartley pattern?
Related pages
About the author

Justin Grossbard is the co-founder and CEO at CompareForexBrokers. He has traded forex since 1998, leads UK broker research and has personally reviewed every FCA-regulated broker on this site. His work has appeared in Forbes, Kiplinger and Finance Magnates, and he holds a Bachelor of Commerce (Honours) and a Master of Marketing.