
Risk warning: CFDs are complex instruments and come with a high risk of losing money rapidly due to leverage. The majority of retail investor accounts lose money when trading CFDs. You should consider whether you understand how CFDs work and whether you can afford to take the high risk of losing your money. This page is general information, not financial advice. Advertiser disclosure.
Candlestick patterns are one- to three-candle shapes that hint at a reversal or continuation. You should never read one on its own; always weigh it against the trend and nearby support or resistance. In my view, the confirmation candle and your risk sizing matter far more than the shape itself. This page sets out the ten most-watched bullish and bearish patterns, how each confirms, and why that discipline is what makes them tradeable.
| Pattern | Direction | Candles | Confirmation |
|---|---|---|---|
| Hammer | Bullish | 1 | Close above the hammer's high |
| Bullish engulfing | Bullish | 2 | Green body engulfs the prior red body |
| Morning star | Bullish | 3 | Third candle closes into the first body |
| Piercing line | Bullish | 2 | Close above the prior red candle's midpoint |
| Three white soldiers | Bullish | 3 | Three rising closes, each near its high |
| Shooting star | Bearish | 1 | Close below the shooting star's low |
| Bearish engulfing | Bearish | 2 | Red body engulfs the prior green body |
| Evening star | Bearish | 3 | Third candle closes into the first body |
| Hanging man | Bearish | 1 | Close below the hanging man's low |
| Three black crows | Bearish | 3 | Three falling closes, each near its low |
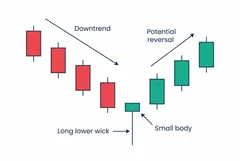 Hammer
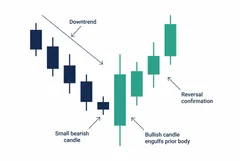 Bullish engulfing
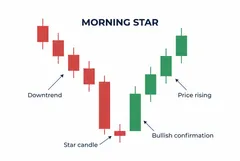 Morning star
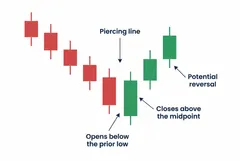 Piercing line
 Three white soldiers
 Shooting star
 Bearish engulfing
 Evening star
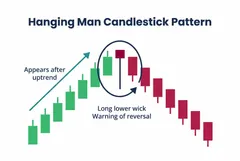 Hanging man
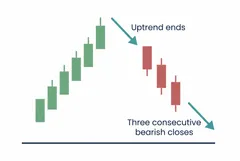 Three black crows
How to read a candlestick
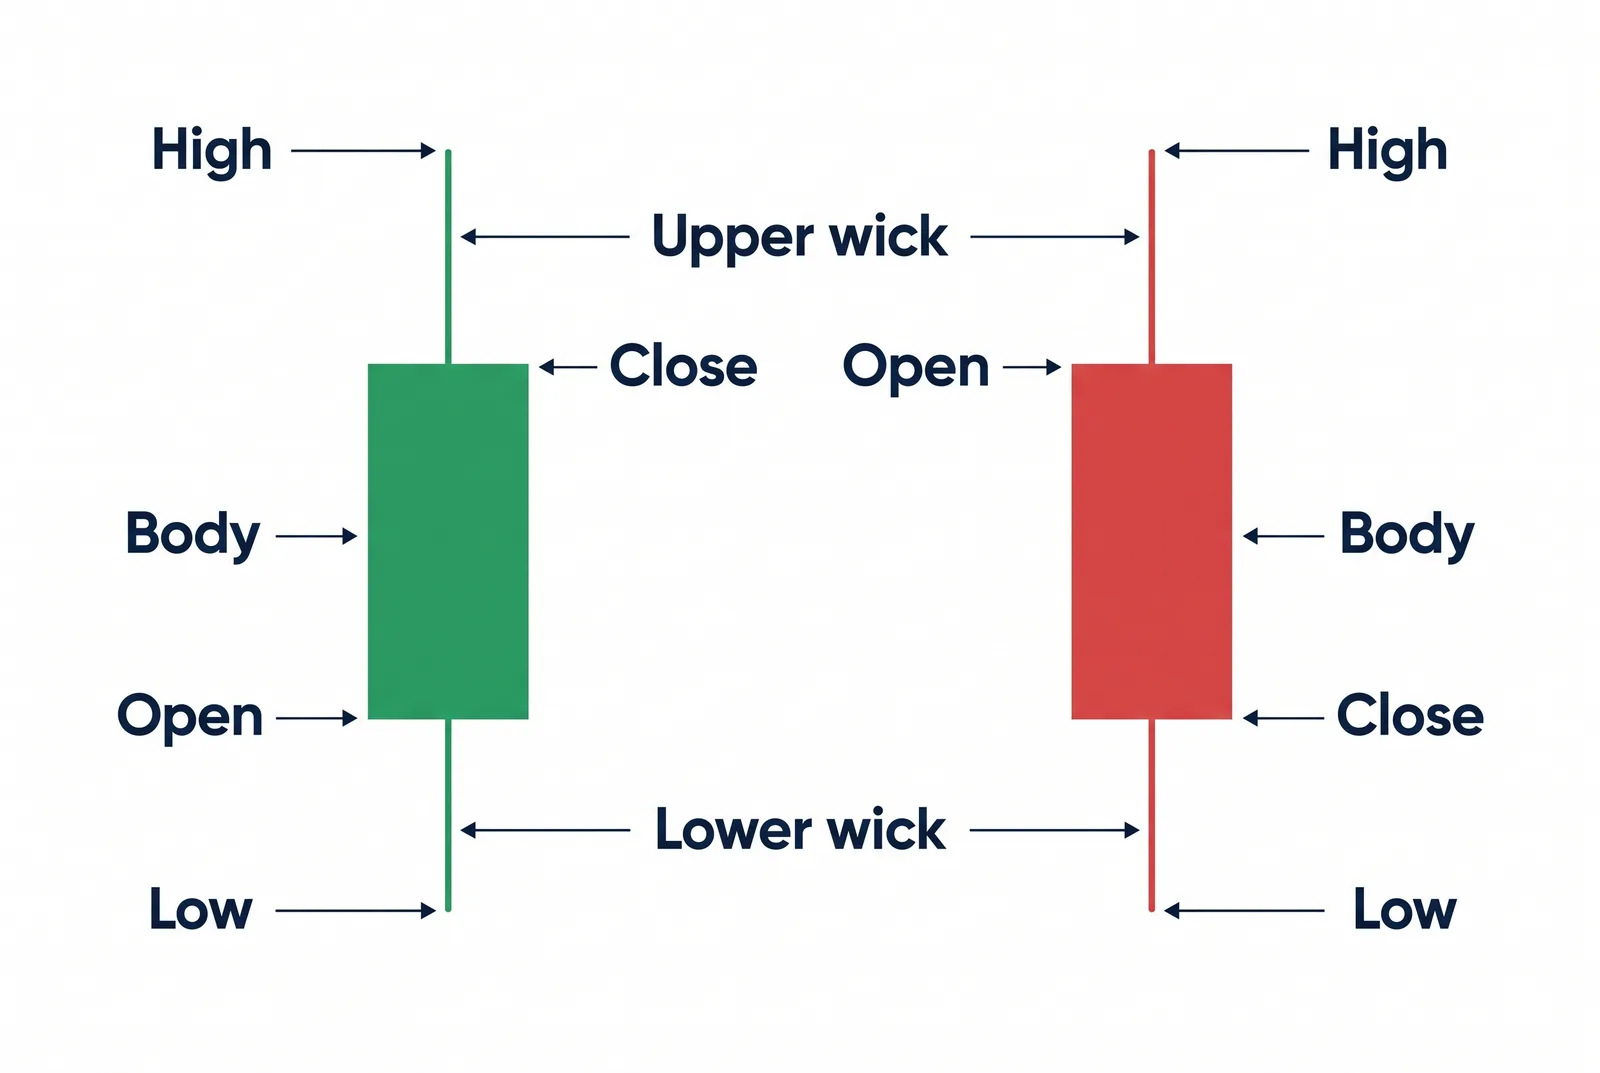
A candlestick captures the open, high, low and close for a given period. The real body is the gap between open and close, green when the close is higher, red when lower. The thin wicks above and below show the session’s extremes. Before you work through the shapes below, get comfortable with the anatomy: I find the body-to-wick balance tells you who controlled the session, and that balance is what makes any pattern legible.
Bullish candlestick patterns
Bullish candlestick patterns suggest a likely move higher, typically a reversal after a decline. I treat each one as a clue only; the next candle must confirm it before I act. They carry more weight when they print at support or after an extended fall, and you should give them little attention in the middle of a range.
Hammer
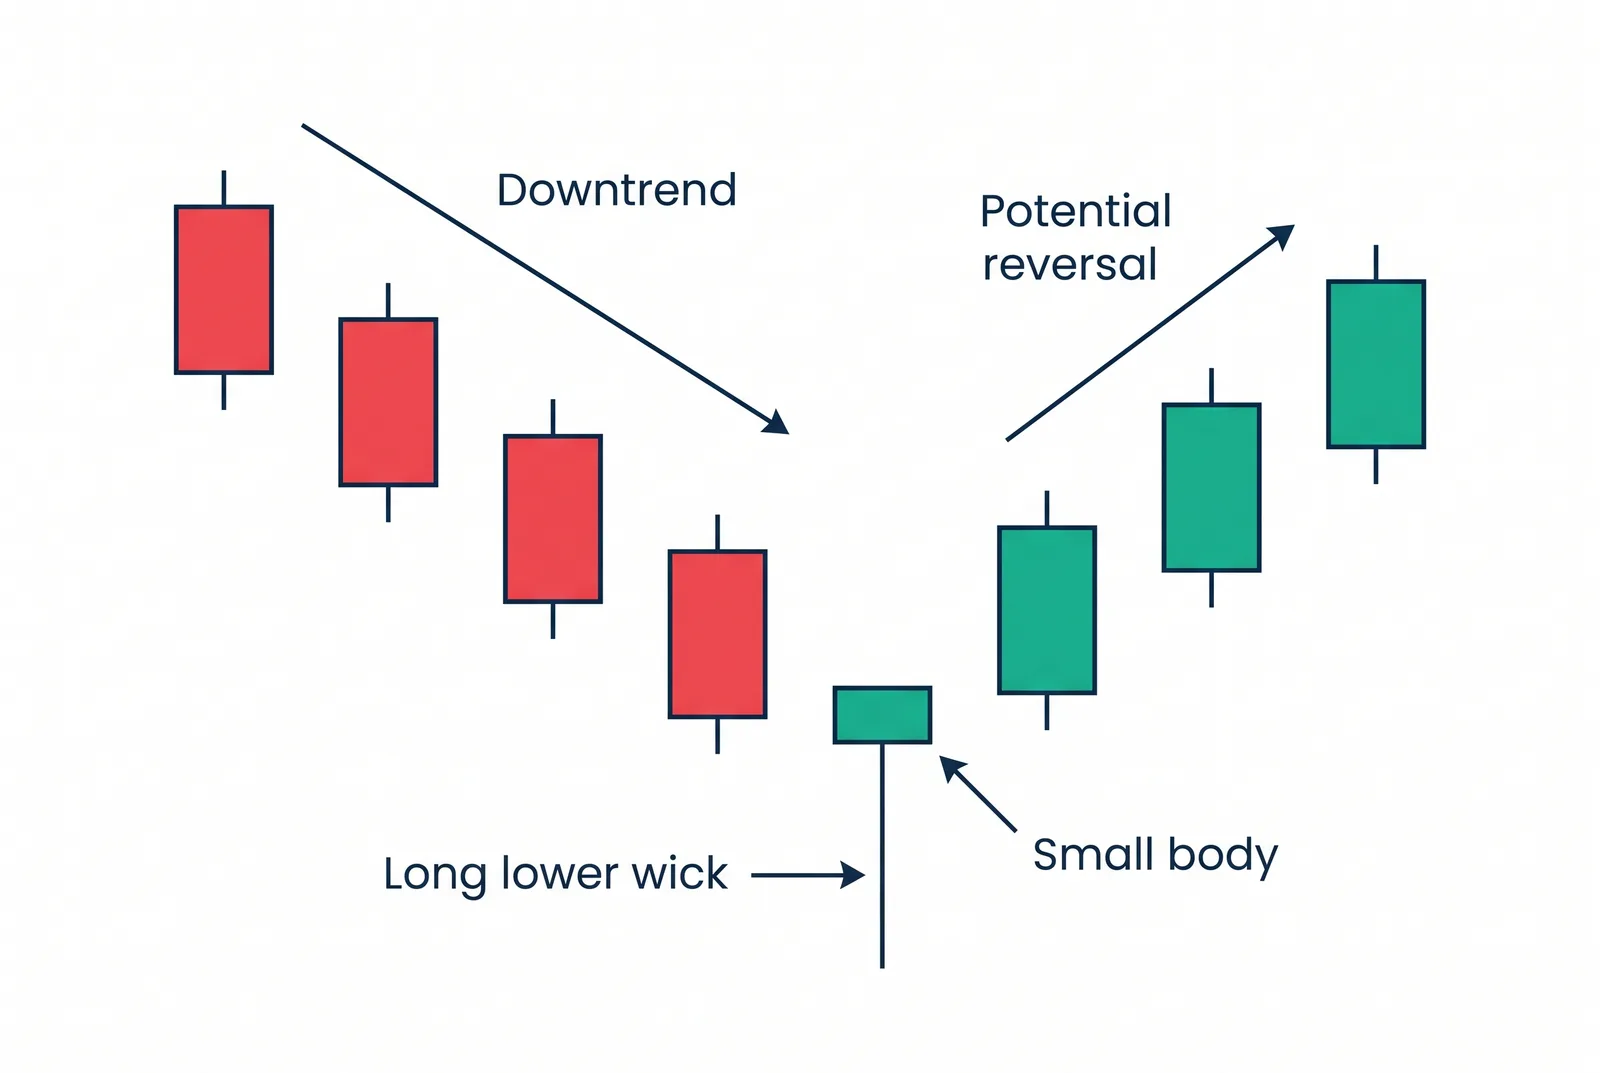
A hammer is a single candle with a small body and a long lower wick that prints after a downtrend. It shows sellers driving price down through the session before buyers push it back near the open, which is what leaves the long tail. The signal confirms when the next candle closes above the hammer’s high, so a hammer on its own is a flag to watch rather than a trade.
Bullish engulfing
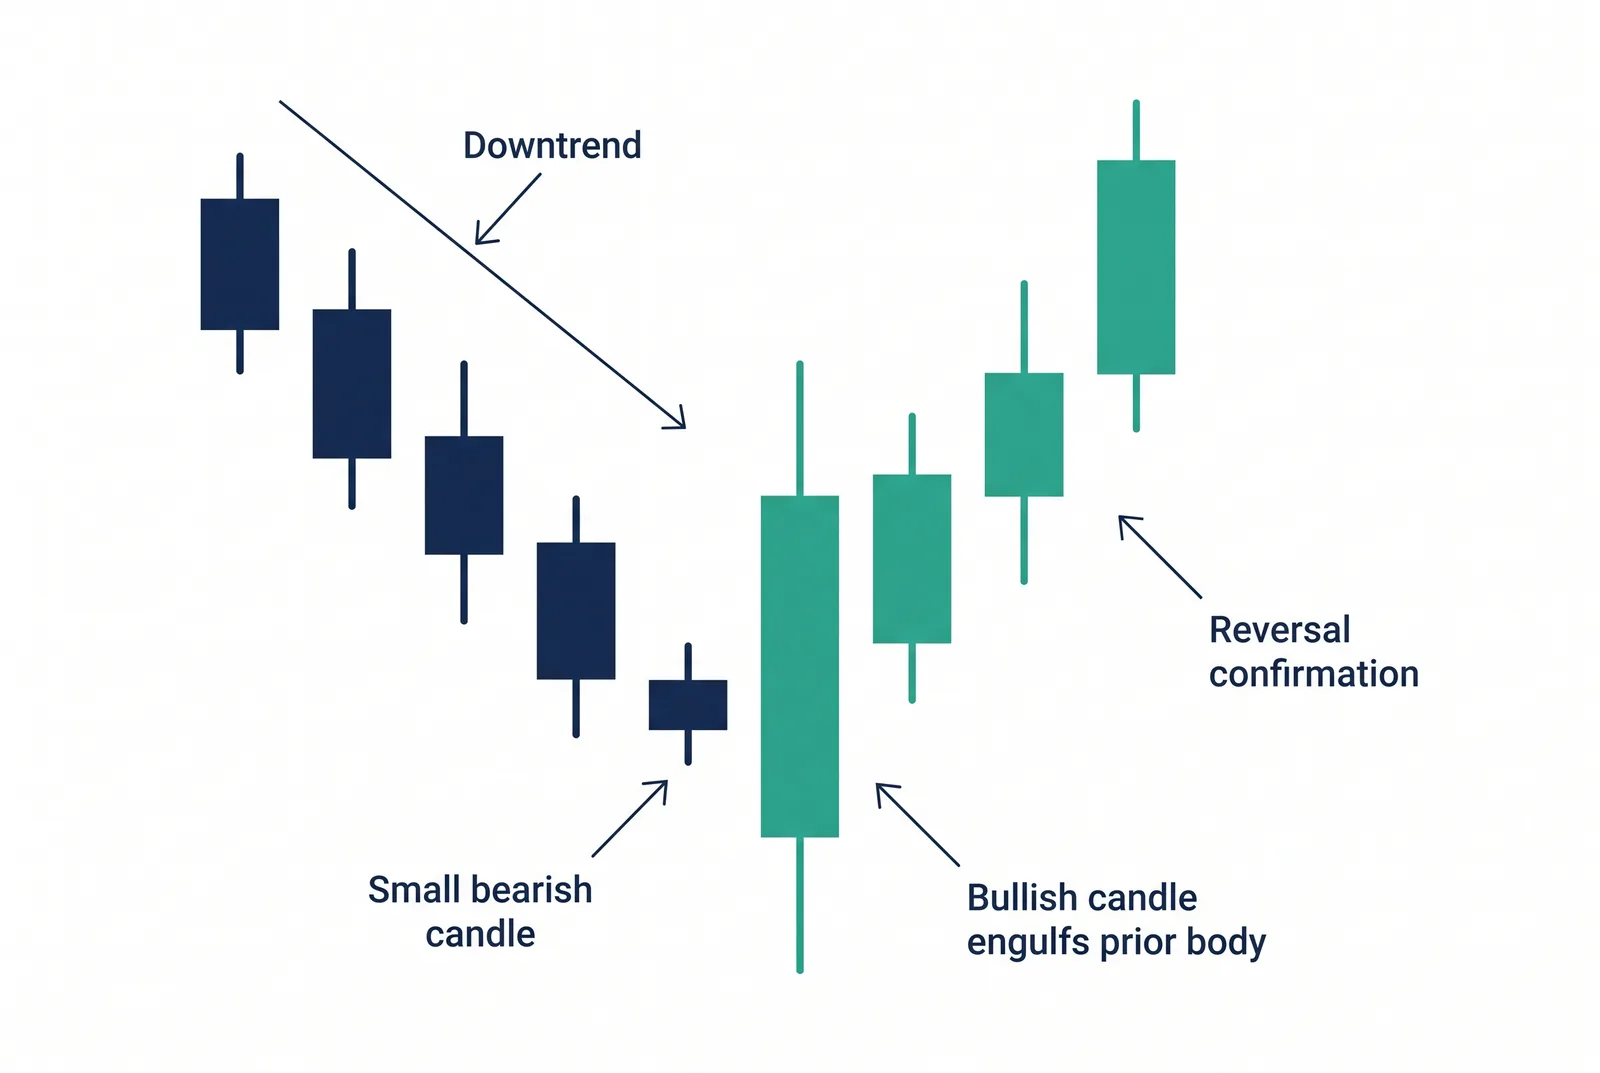
A bullish engulfing pattern is two candles: a small red candle followed by a larger green one whose body completely covers the previous body. The green candle takes back everything the previous session gave up, a clean handover from sellers to buyers, and it is most convincing after a run of lower closes. The wider that green body against recent candles, the more decisive the turn.
Morning star
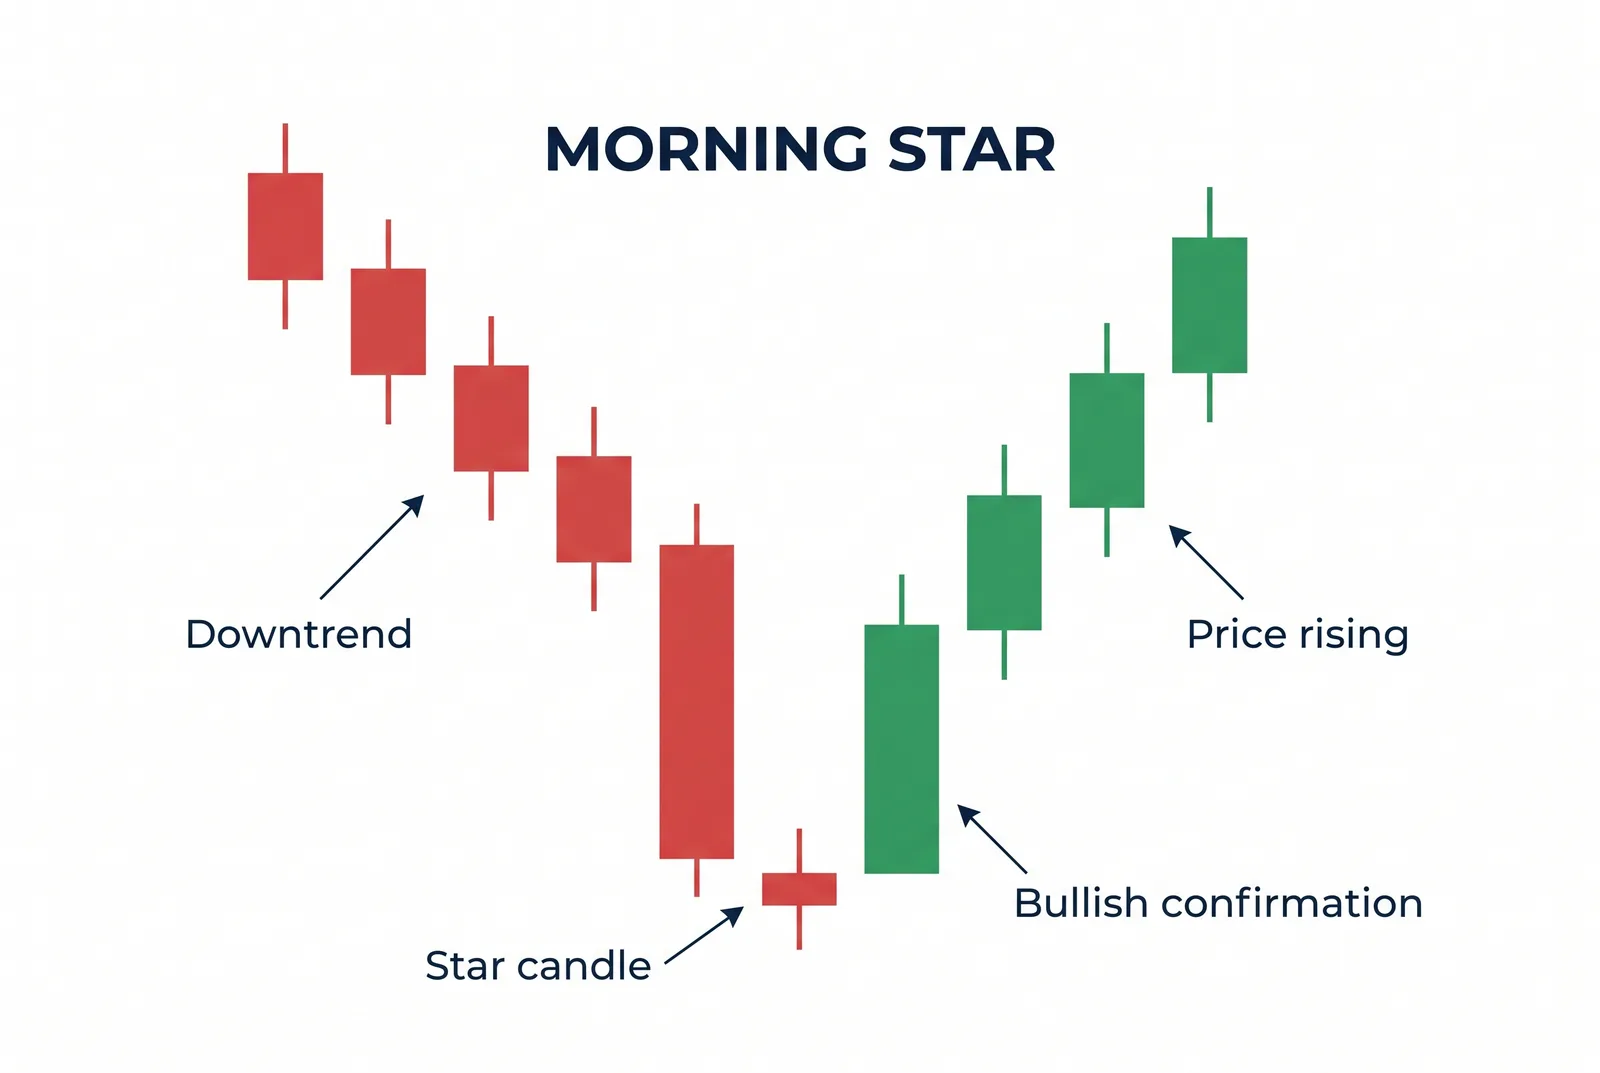
A morning star is a three-candle bottom: a long red candle, then a small-bodied candle that stalls or gaps, then a green candle that closes well into the first body. The small middle candle is the turning point, where selling pressure runs out before buyers step in on the third session. It confirms as the third candle closes, not on the star itself.
Piercing line
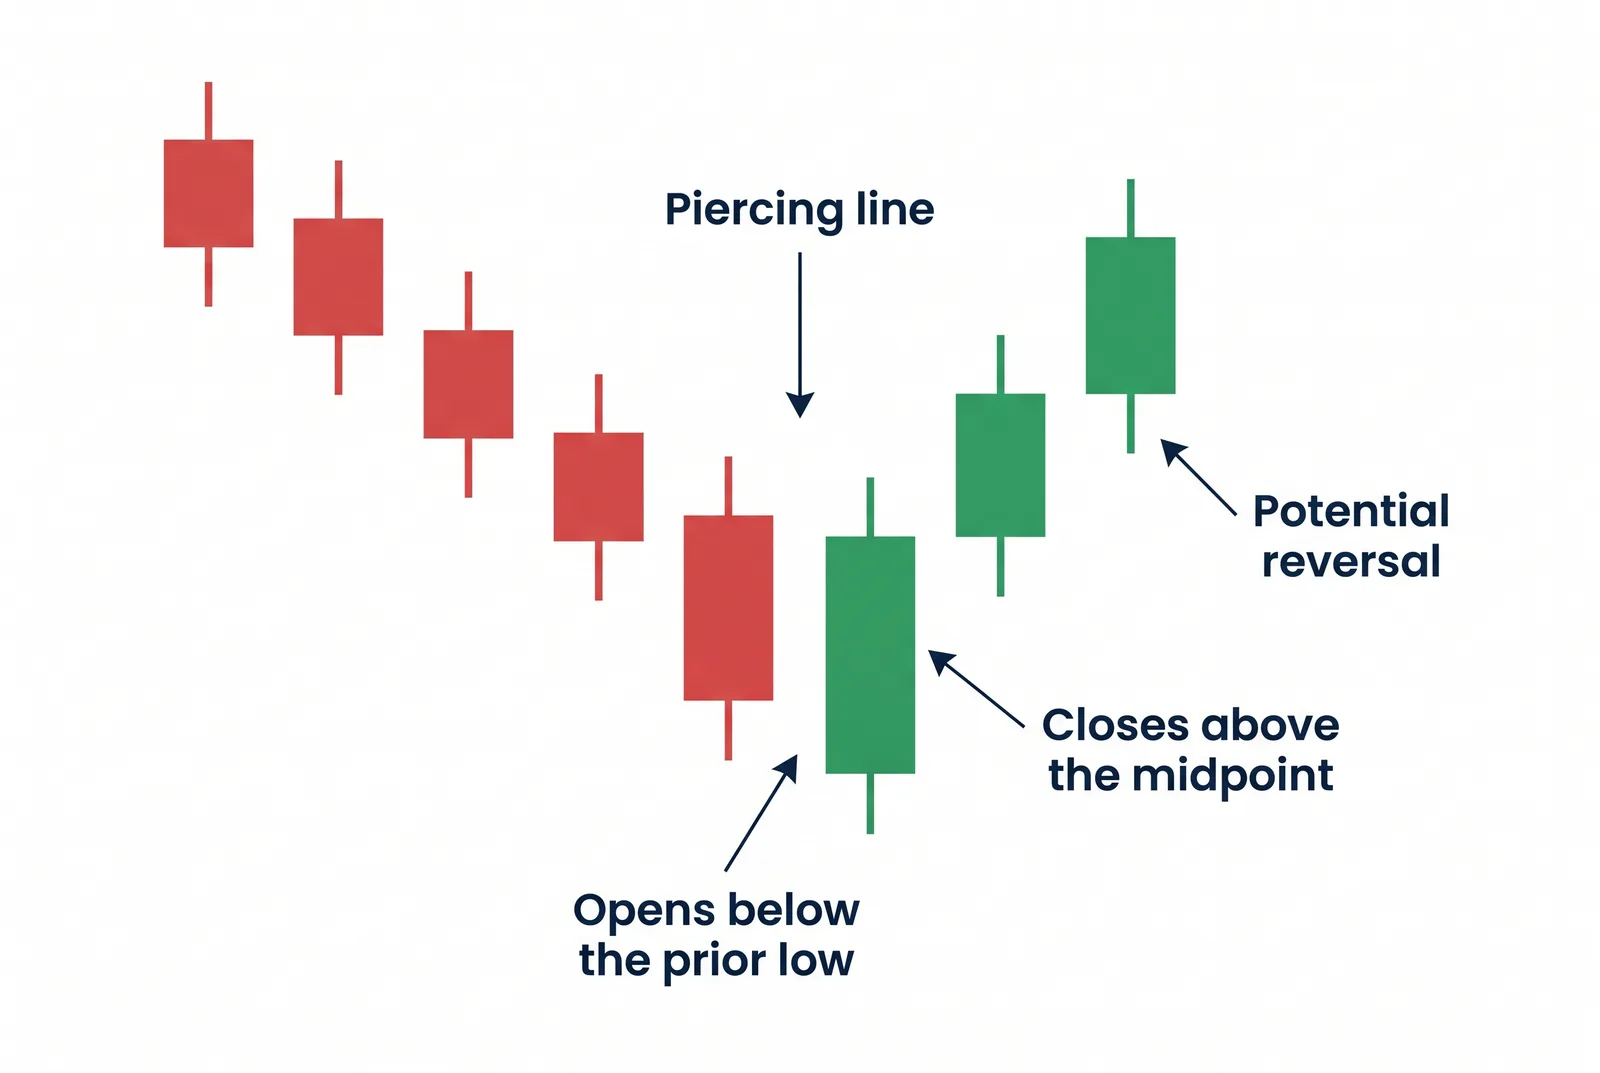
A piercing line is a two-candle reversal where a green candle opens below the prior red candle’s low and then closes back above the midpoint of that red body. Closing beyond the halfway mark is the detail that separates it from a shallow bounce that fades. Like the other reversals here, it is more reliable after a clear downtrend.
Three white soldiers
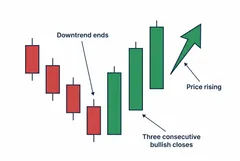
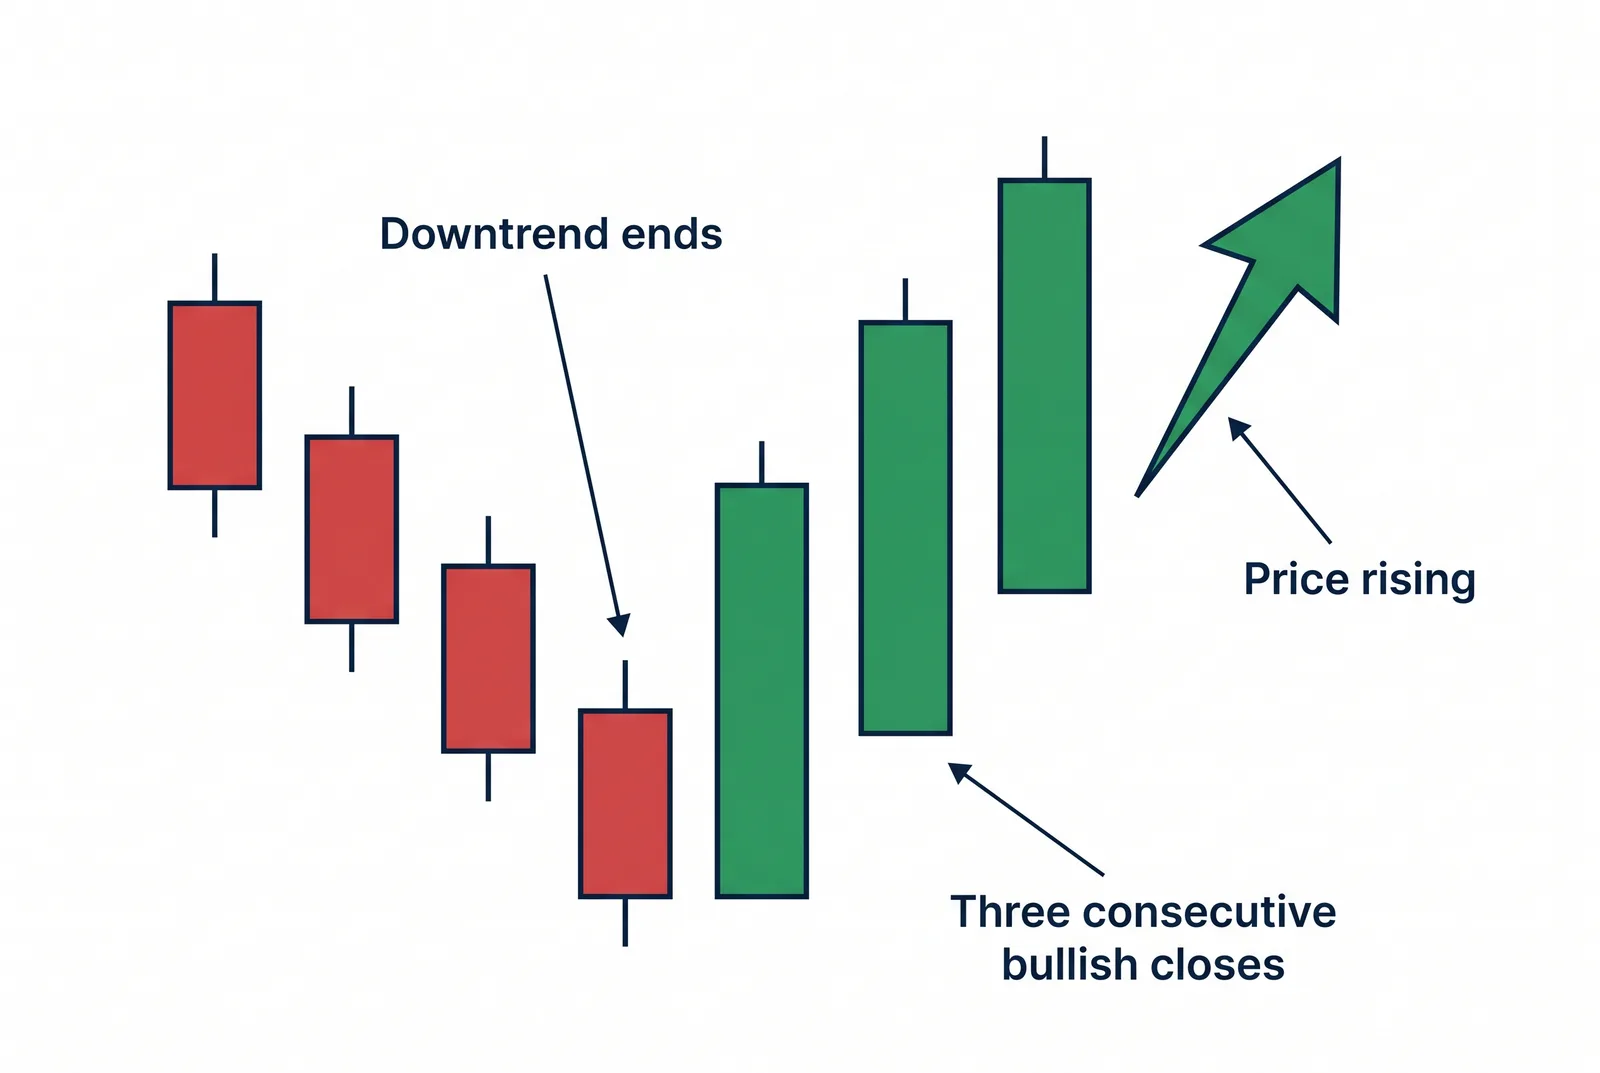
Three white soldiers are three tall green candles in a row, each opening within the previous body and closing near its high. The pattern shows steady, repeated buying rather than a single spike, which is why it reads as a durable reversal signal. A break in that rhythm, such as a candle closing well off its high, weakens the read.
Bearish candlestick patterns
Bearish candlestick patterns point to a likely move lower, usually a reversal after a rise. The same discipline applies: you wait for the next candle to confirm, and you read them best at resistance or after an extended advance. In a choppy range, you should not rely on them.
Shooting star
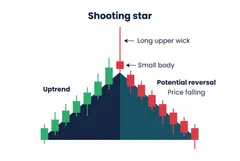
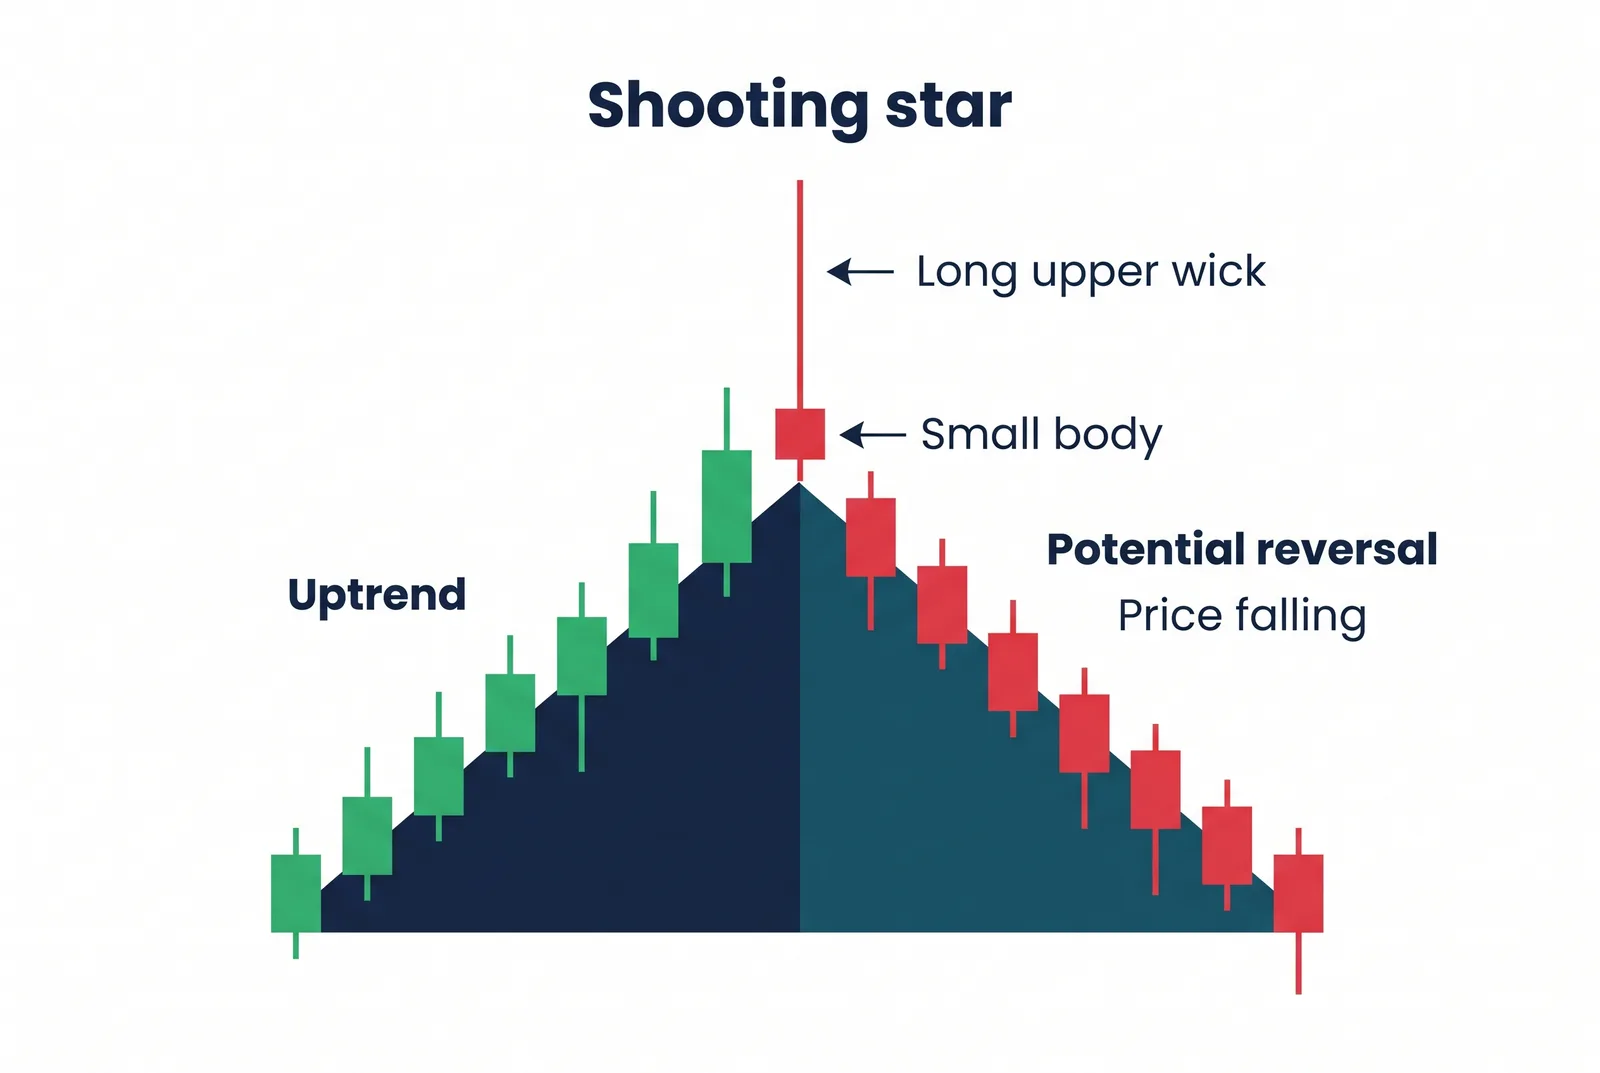
A shooting star is a single candle with a small body and a long upper wick that appears at the top of an uptrend. Buyers push price up during the session, but sellers reject the high and force the close back near the open, leaving the long wick above. It confirms when the next candle closes below the shooting star’s low.
Bearish engulfing
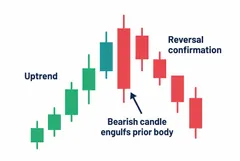
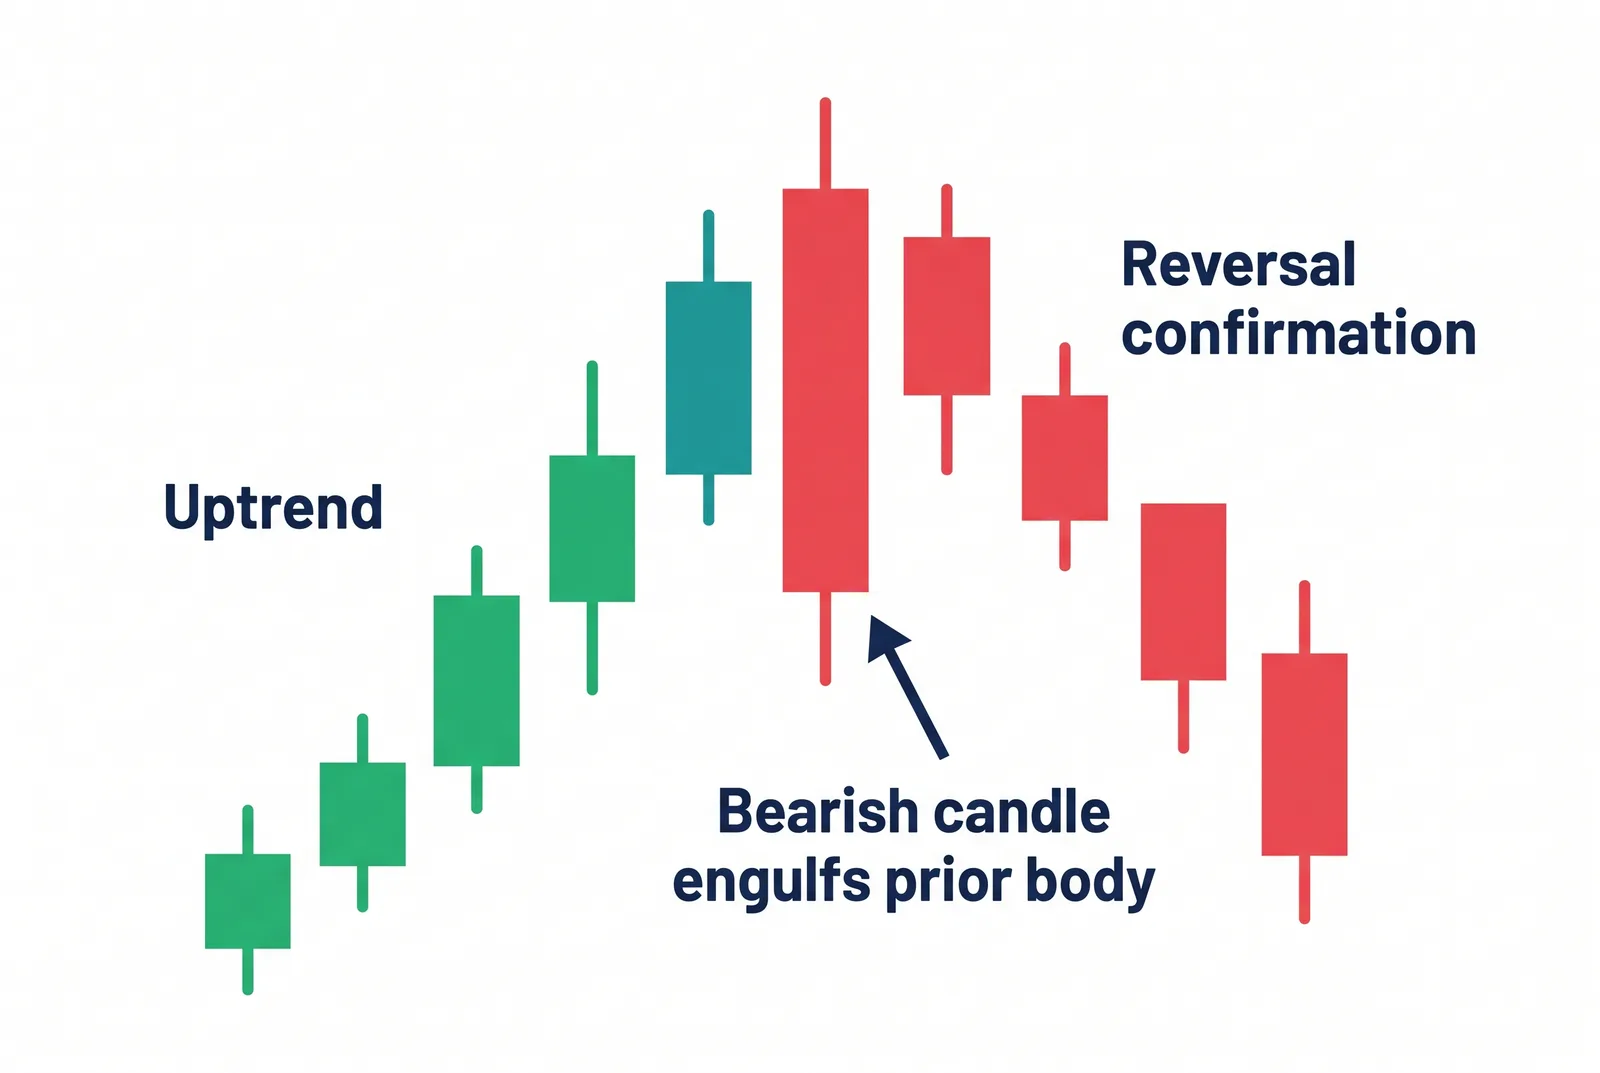
A bearish engulfing pattern is a small green candle followed by a larger red one whose body completely covers it. The red candle wipes out the prior session’s buying in a single move, and it is most telling after a stretch of higher closes. As with its bullish mirror, the wider the red body, the stronger the signal.
Evening star
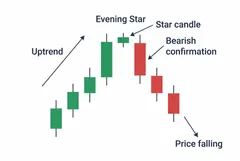
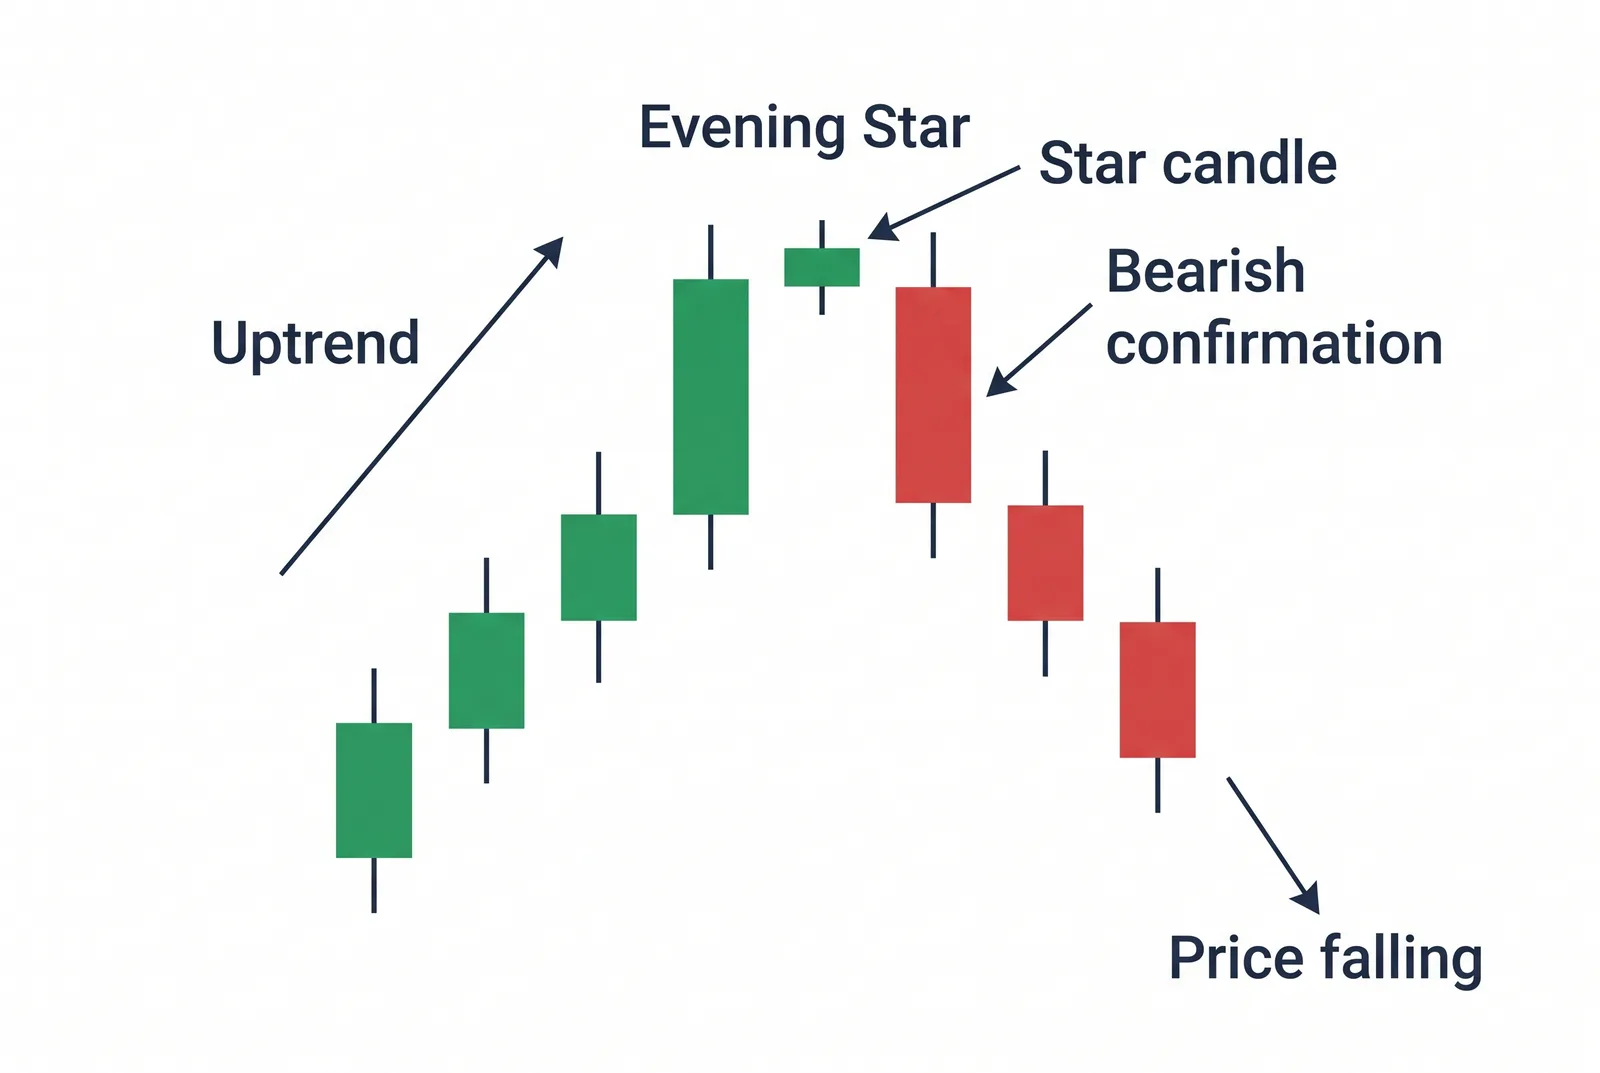
An evening star is the bearish mirror of the morning star: a long green candle, a small indecisive candle at the high, then a red candle that closes well into the first body. The star is the stall at the top before sellers take over on the third session. Confirmation comes on the close of that third candle.
Hanging man
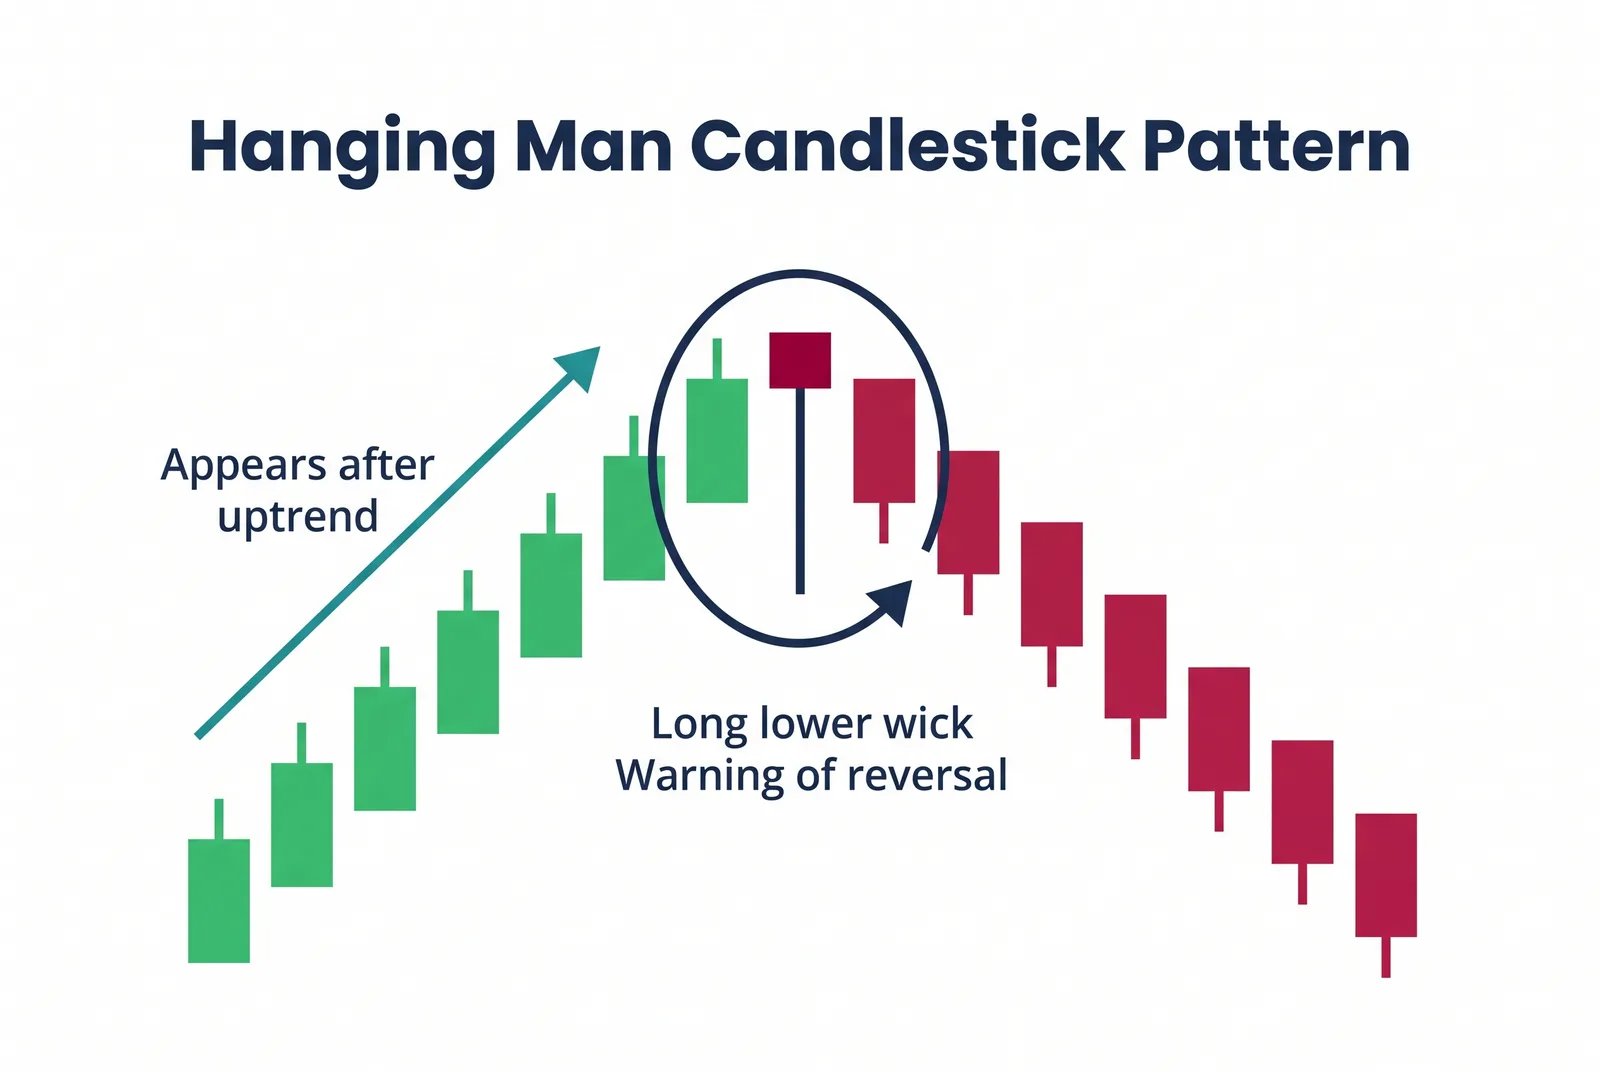
A hanging man has the same shape as a hammer, a small body with a long lower wick, but it prints at the top of an uptrend rather than the bottom of a downtrend. In that position the long lower wick warns that selling appeared intrasession even as price stayed elevated. It is a weaker signal than an engulfing pattern and needs the next candle to close lower to confirm.
Three black crows
Three black crows are three tall red candles in a row, each opening within the previous body and closing near its low. Like three white soldiers in reverse, the pattern shows sustained selling rather than one sharp drop, which is what gives it weight at the top of a move. Watch for the run becoming overextended, since a deep sequence of crows can precede a short-term bounce.
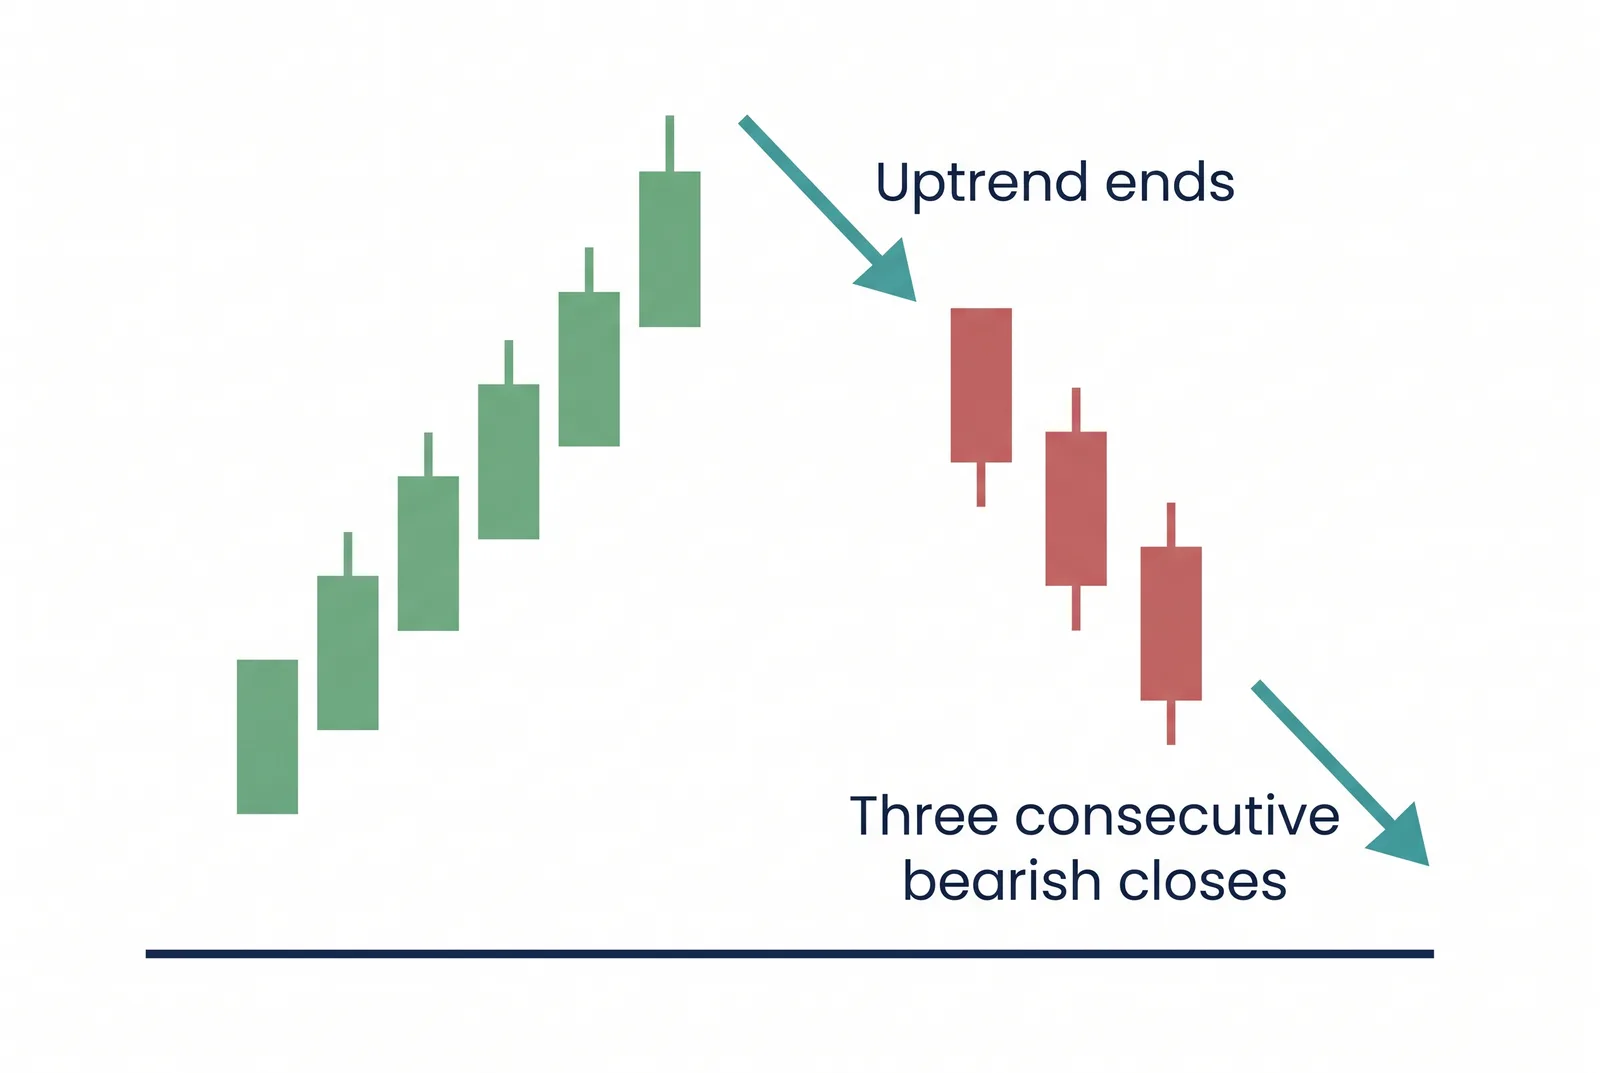
How candlestick patterns confirm
I treat a candlestick pattern as a setup, not a signal, until the market confirms it. For most reversals, I wait for the next candle to close in the pattern’s direction, ideally on rising volume. A platform that plots volume alongside price, such as MT4, makes it easier to judge that confirmation. Acting on the shape alone invites false signals. Context matters as much as the shape: the same pattern is worth more at support or resistance than in the middle of a range, and more after an extended move than in choppy conditions. TradingView can flag many of these patterns automatically, but a scanner does not judge context, so you should treat it as a shortlist.
Managing the risk
Candlestick patterns give you a natural place to set a stop: just beyond the wick that defines the pattern, below a hammer’s low or above a shooting star’s high, so the trade is invalidated cleanly if that level breaks. Size your position so the loss to the stop is a fixed, small share of your account, as the stop-loss guide explains. Keep any leverage within the FCA retail caps, 30:1 on major pairs, with the 50% margin close-out and negative balance protection as backstops. A pattern improves the odds of a setup; it does not change the fact that most retail accounts lose money trading CFDs.
Common mistakes
I see traders make this mistake often: trading the shape before it confirms. An unconfirmed hammer or engulfing candle fails regularly. If you read a pattern in isolation, without the trend or a nearby level, you force trades the chart does not support. Treating a single candle as a certainty removes the stop and sizing that make a pattern worth trading. For multi-candle formations, see the bullish chart patterns and bearish chart patterns pages, and the patterns hub to see how the families fit together.
Candlesticks are the shortest-timeframe signals of the four families, which is why confirmation matters most here. Our position size calculator sizes the trade once the stop is set, and the multi-bar formations sit on bullish chart patterns for UK traders and bearish chart patterns for UK traders. For the wider picture, start at our education hub.
Our reviews are reader-supported. We may receive payment when you click a link to a partner site. Learn how we make money.
FAQs
What are candlestick patterns?
How do I confirm a candlestick pattern?
Are candlestick patterns reliable?
What is the difference between candlestick patterns and chart patterns?
Related pages
About the author

Justin Grossbard is the co-founder and CEO at CompareForexBrokers. He has traded forex since 1998, leads UK broker research and has personally reviewed every FCA-regulated broker on this site. His work has appeared in Forbes, Kiplinger and Finance Magnates, and he holds a Bachelor of Commerce (Honours) and a Master of Marketing.